Comparison of Forcing Data:
NCC: NCC forcing dataset
GPCC: Global Preciptiation Climatology Centre
WFD: Watch Forcing Dataset
GSWP3: GSWP3 beta forcing dataset
Time period: 1990-1999 inclusive
Scale: Monthly
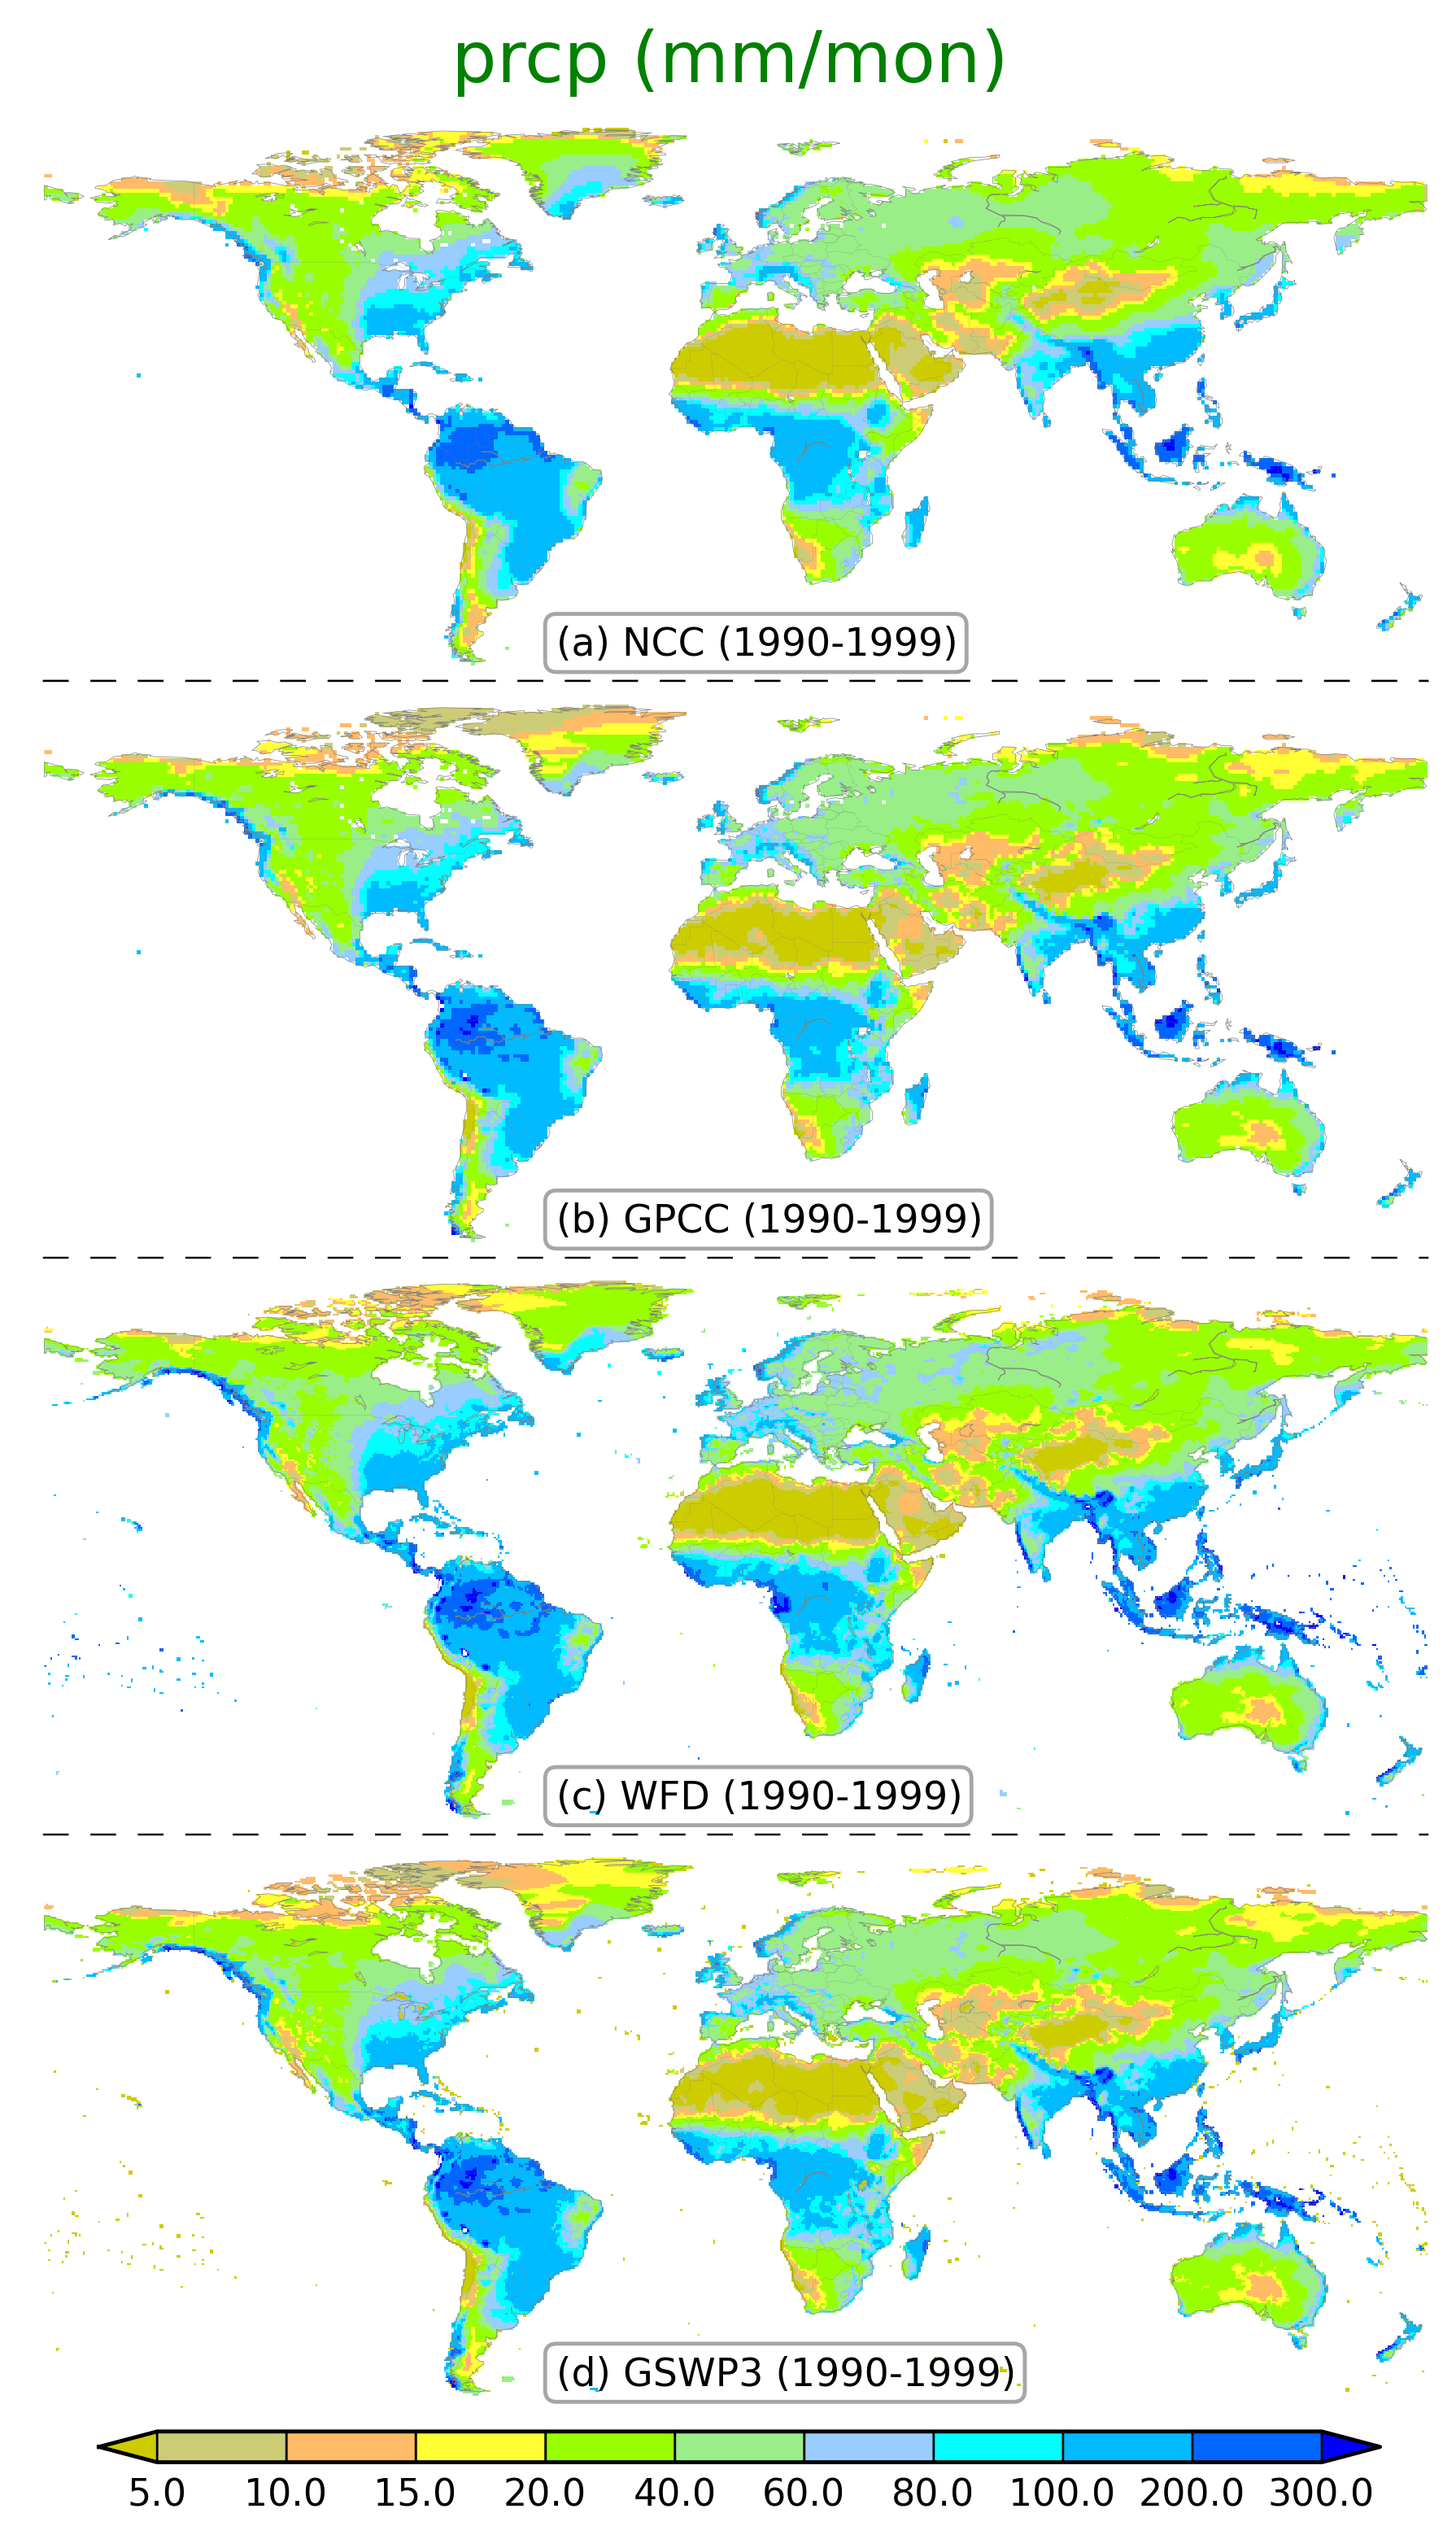 Total Precipitation |
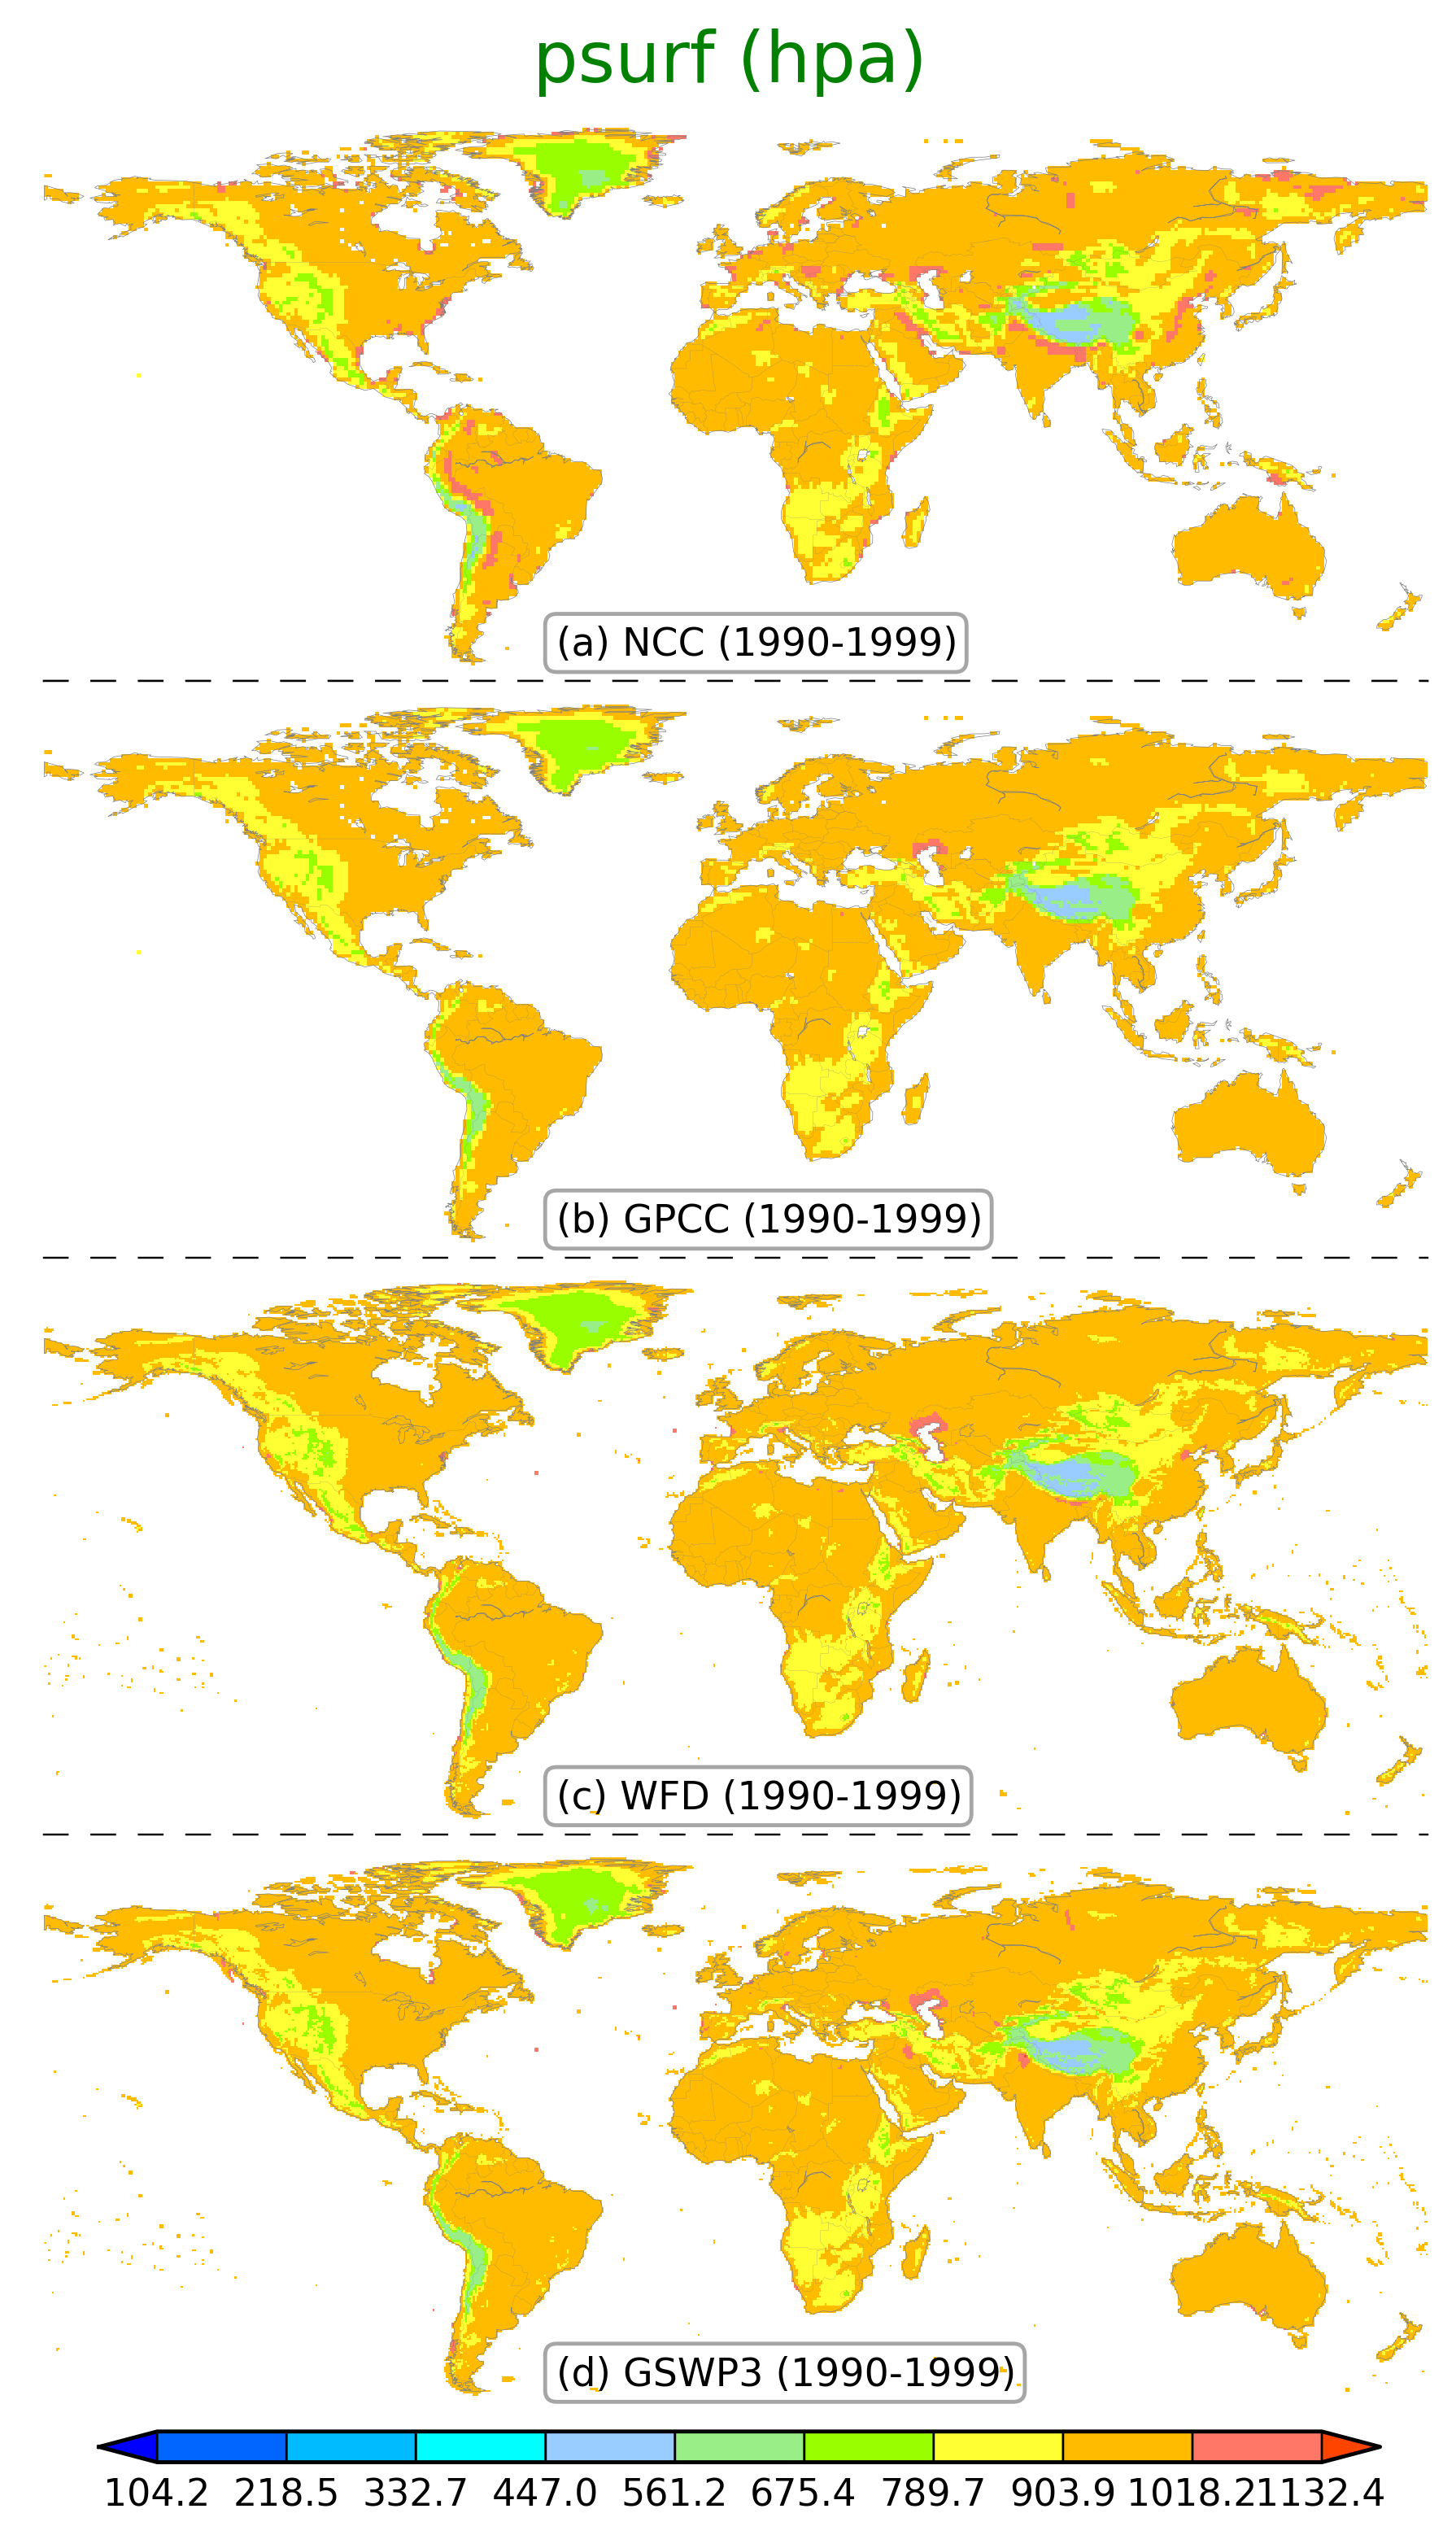 Surface Pressure |
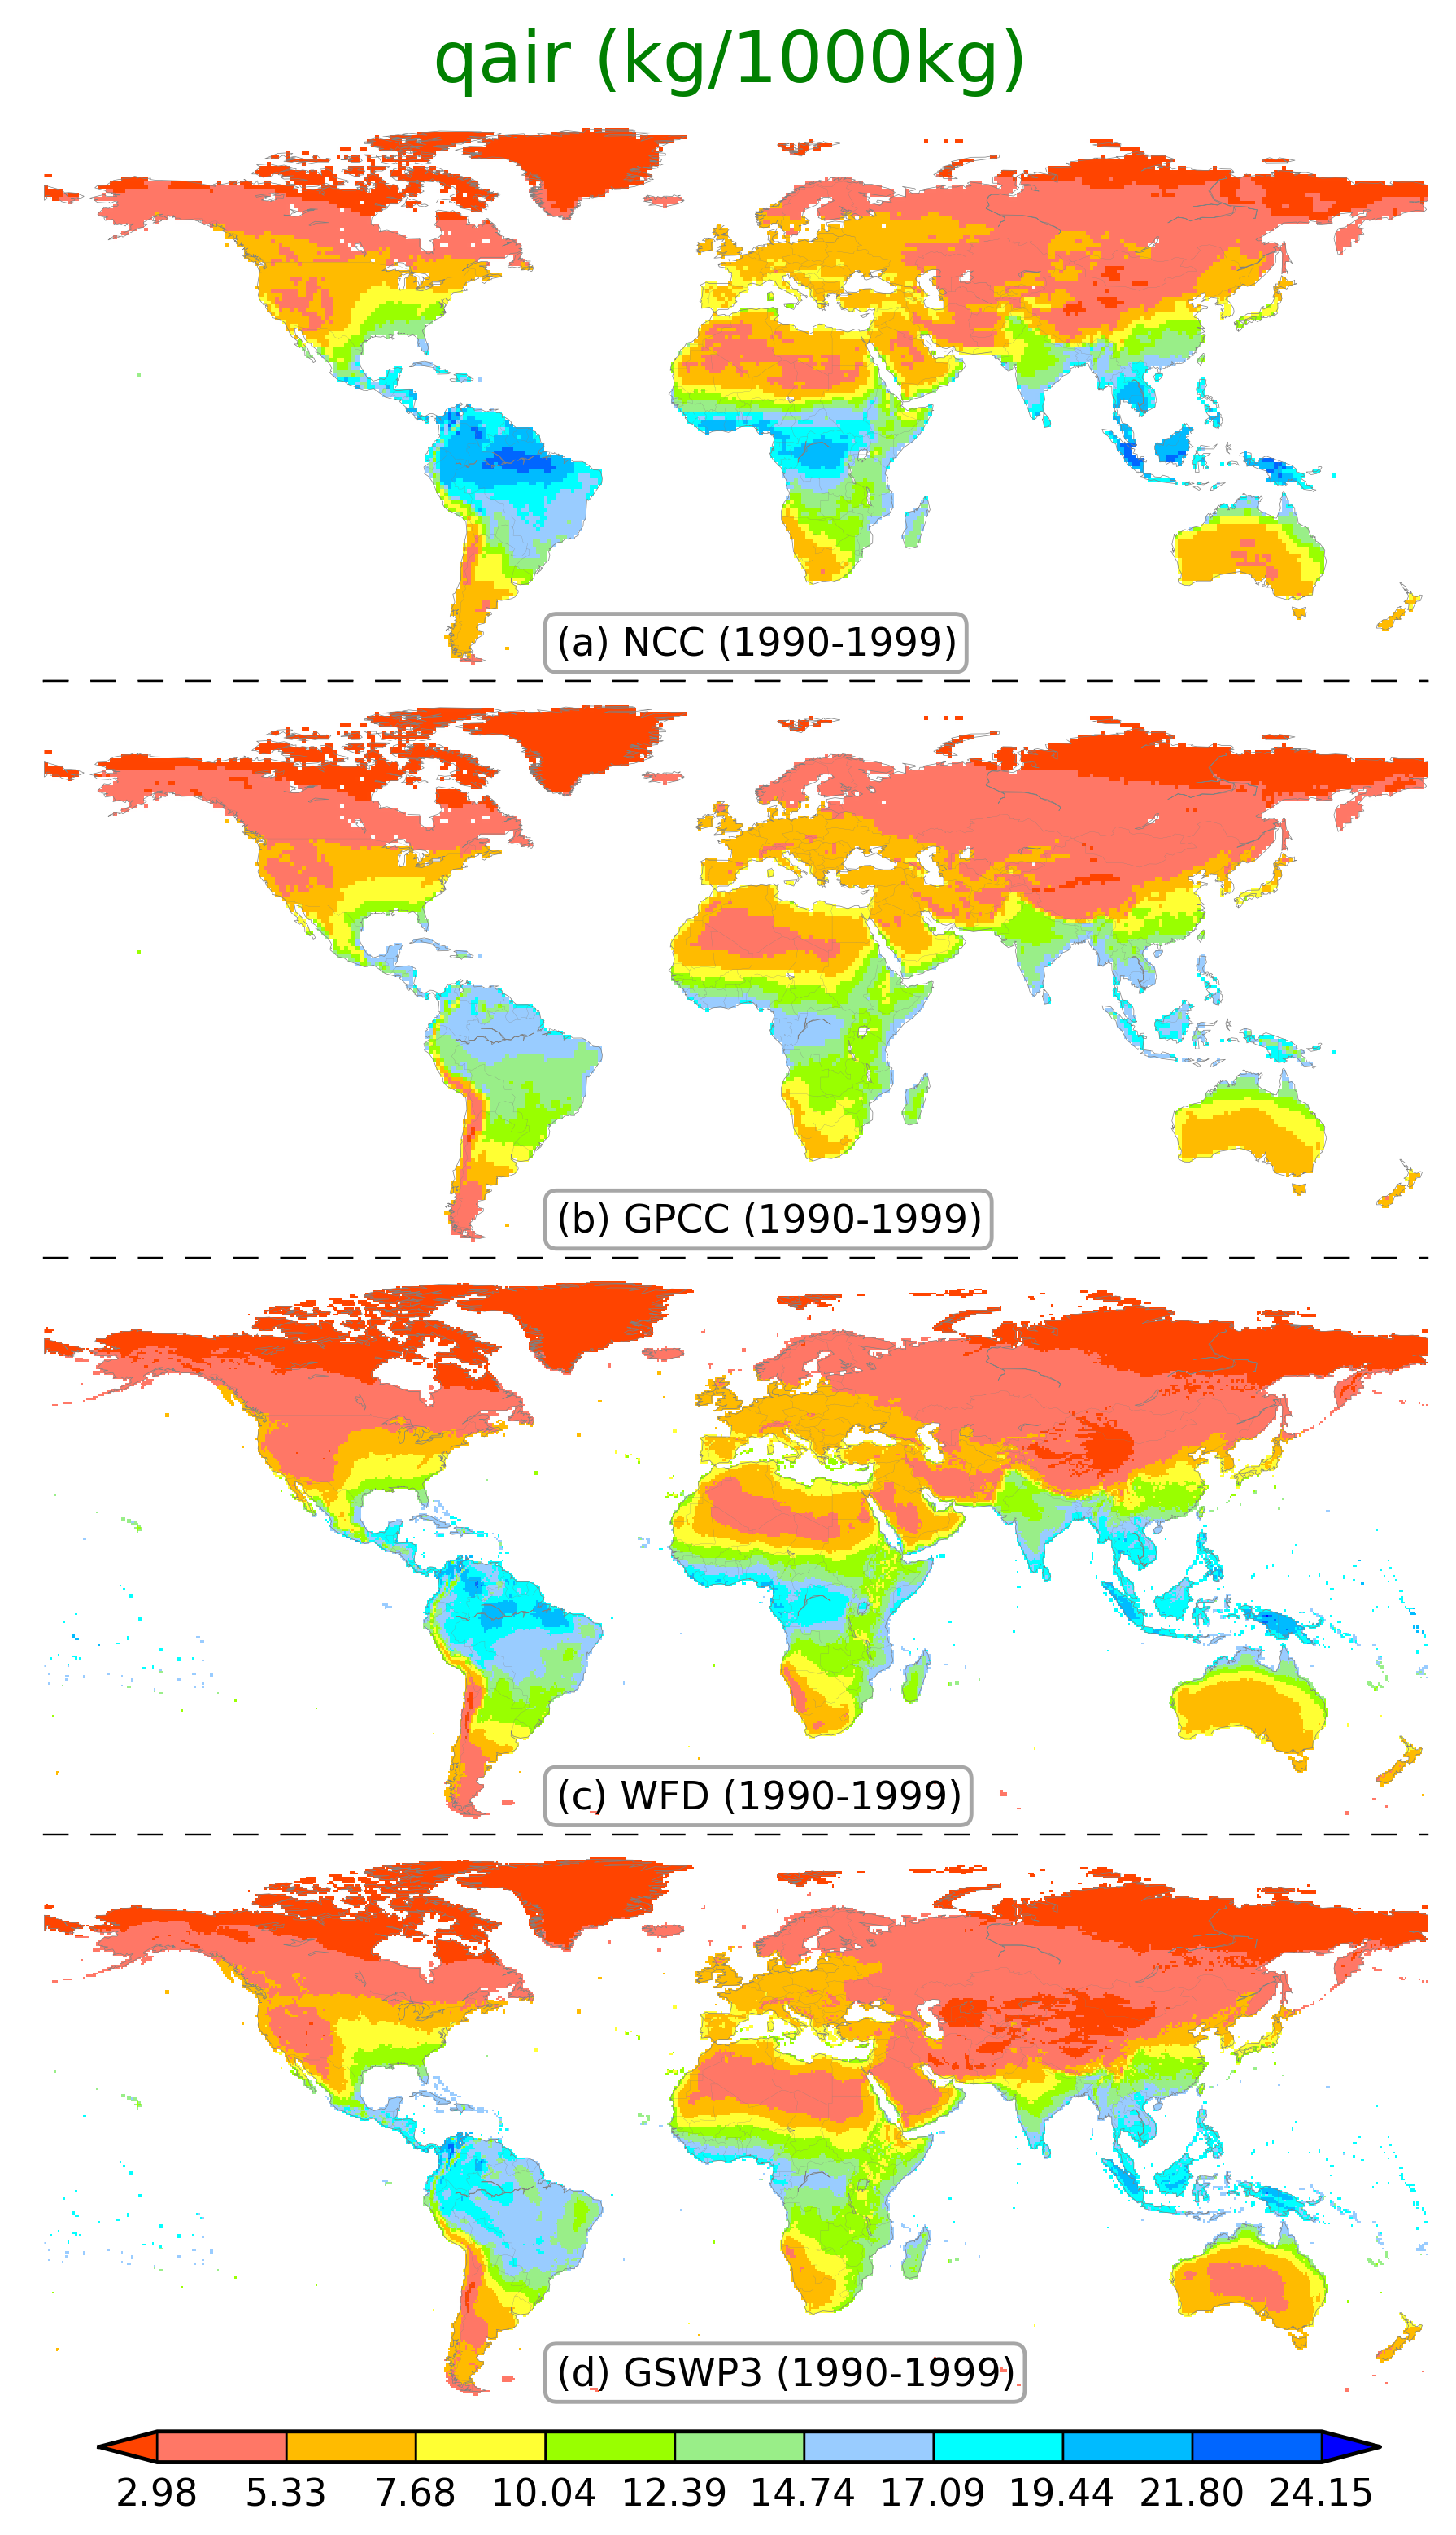 Specific Humidity |
 Wind Speed |
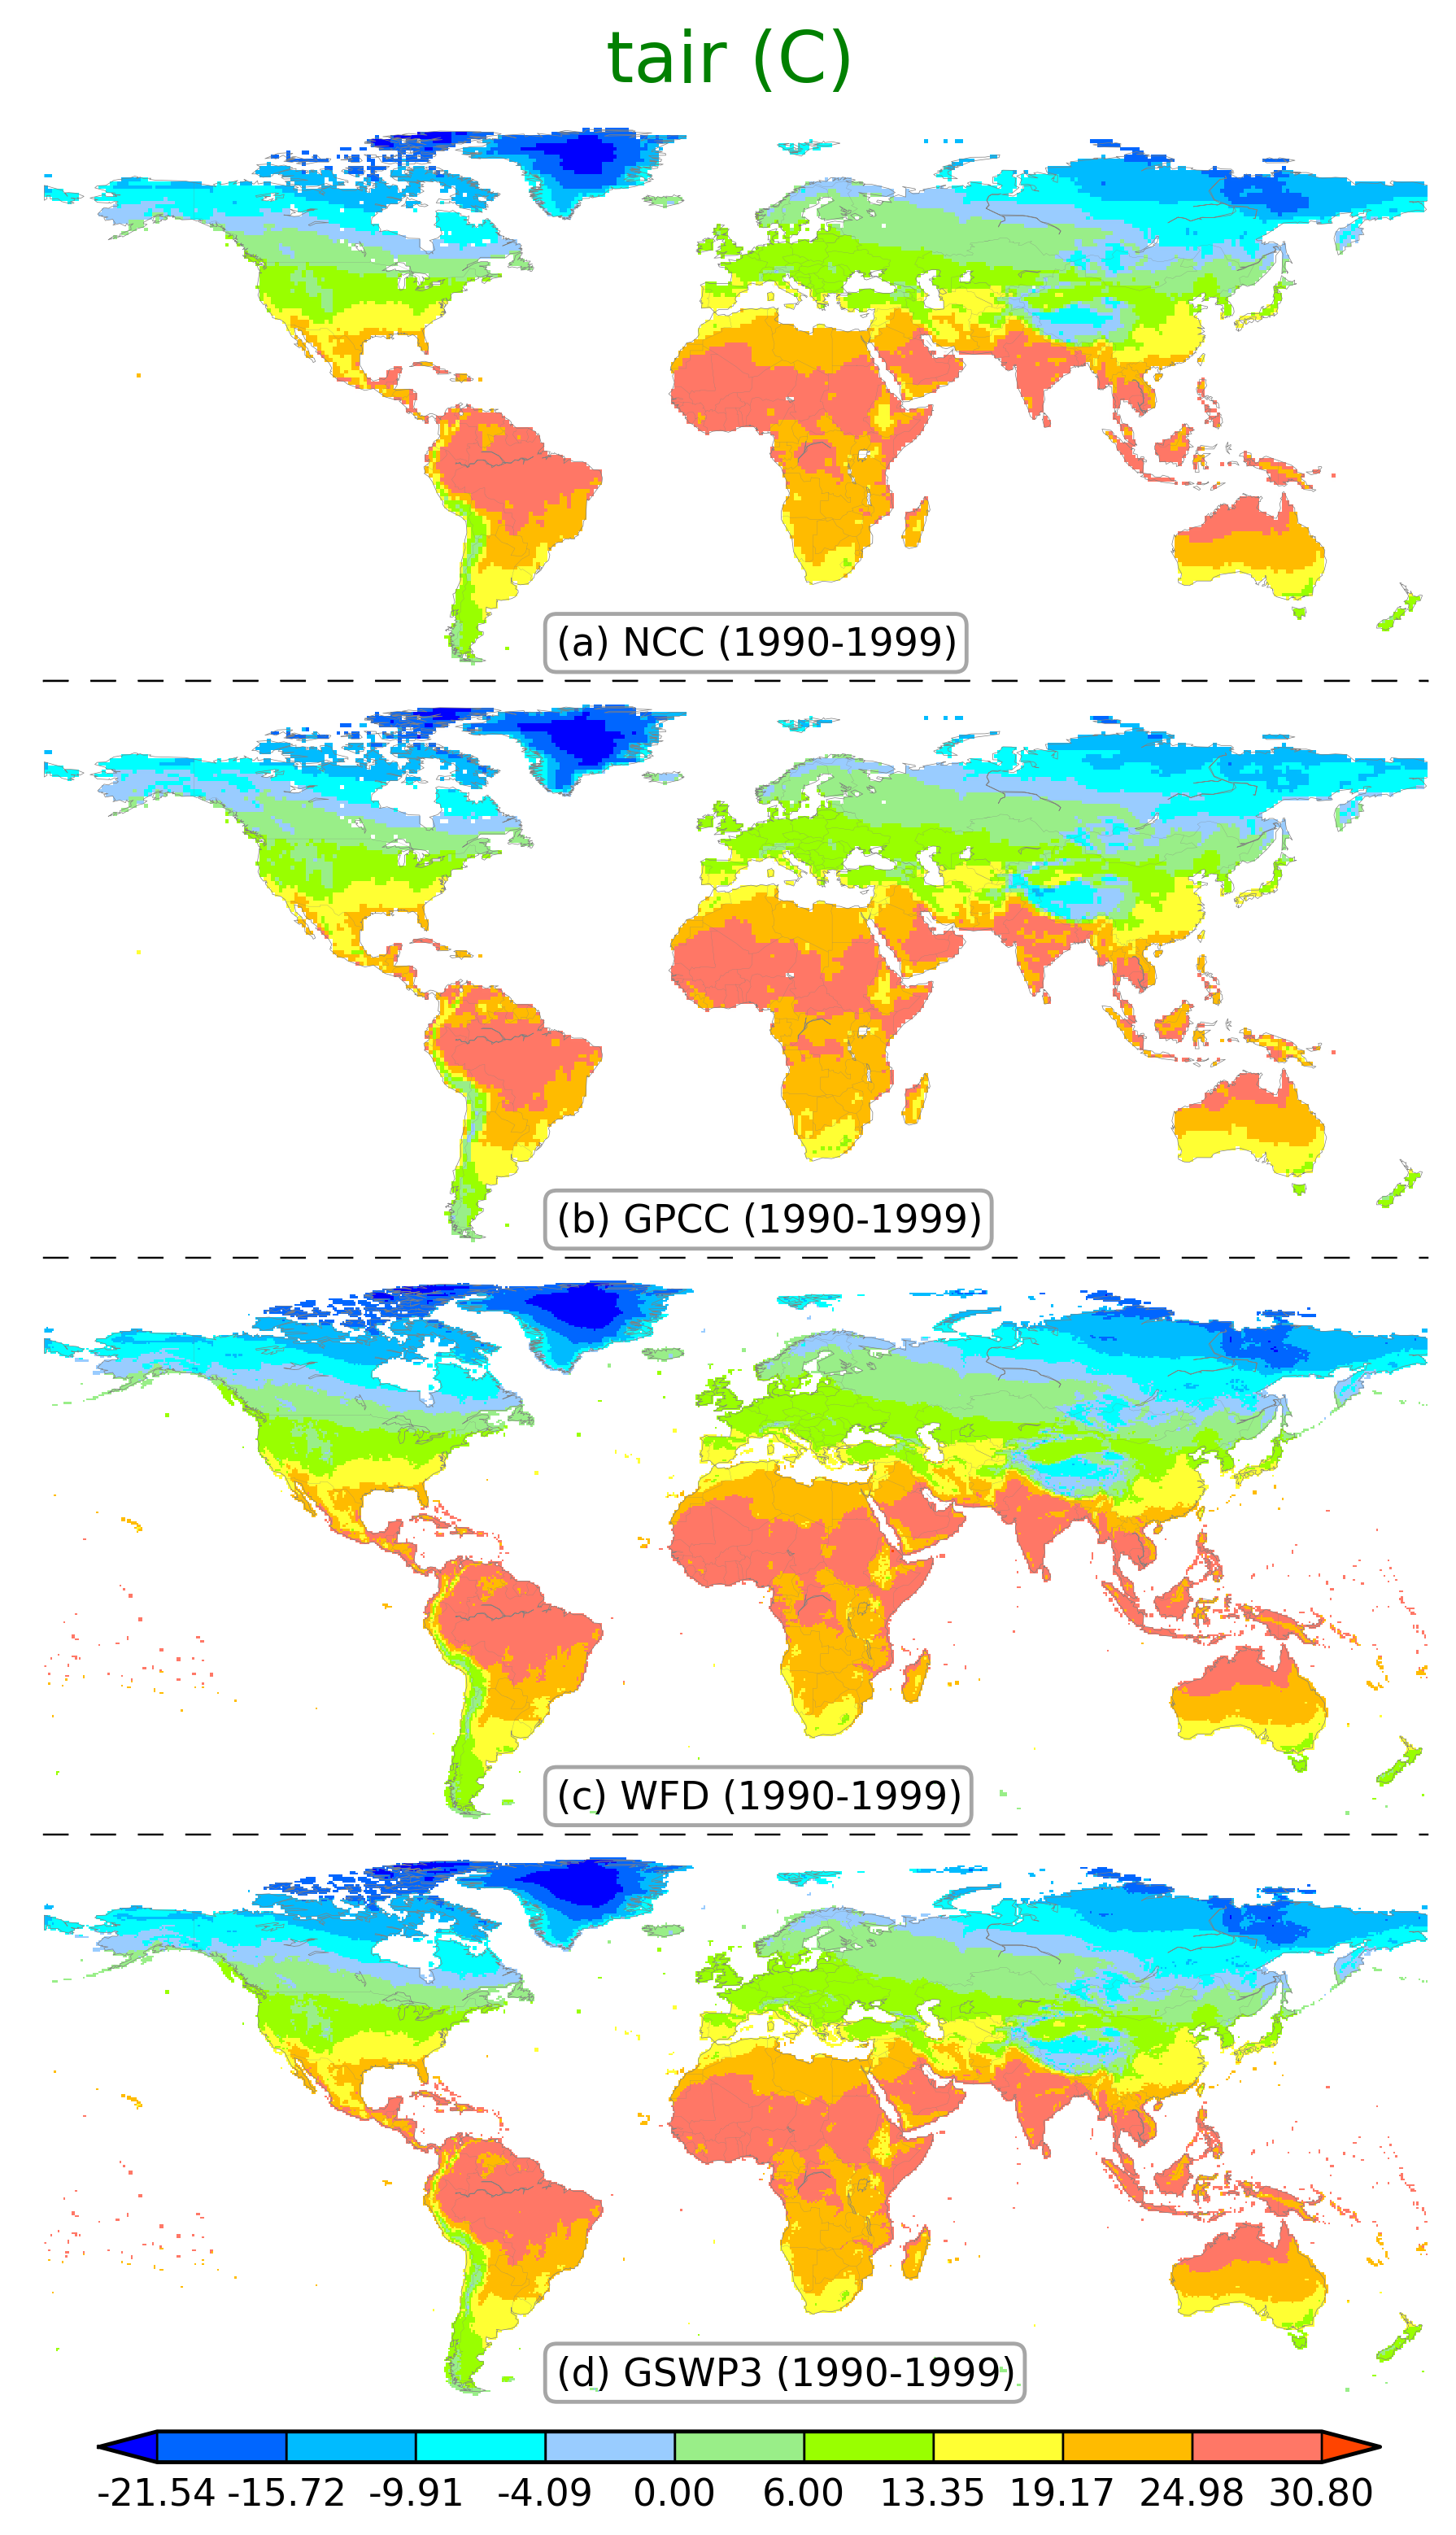 Air Temperature |
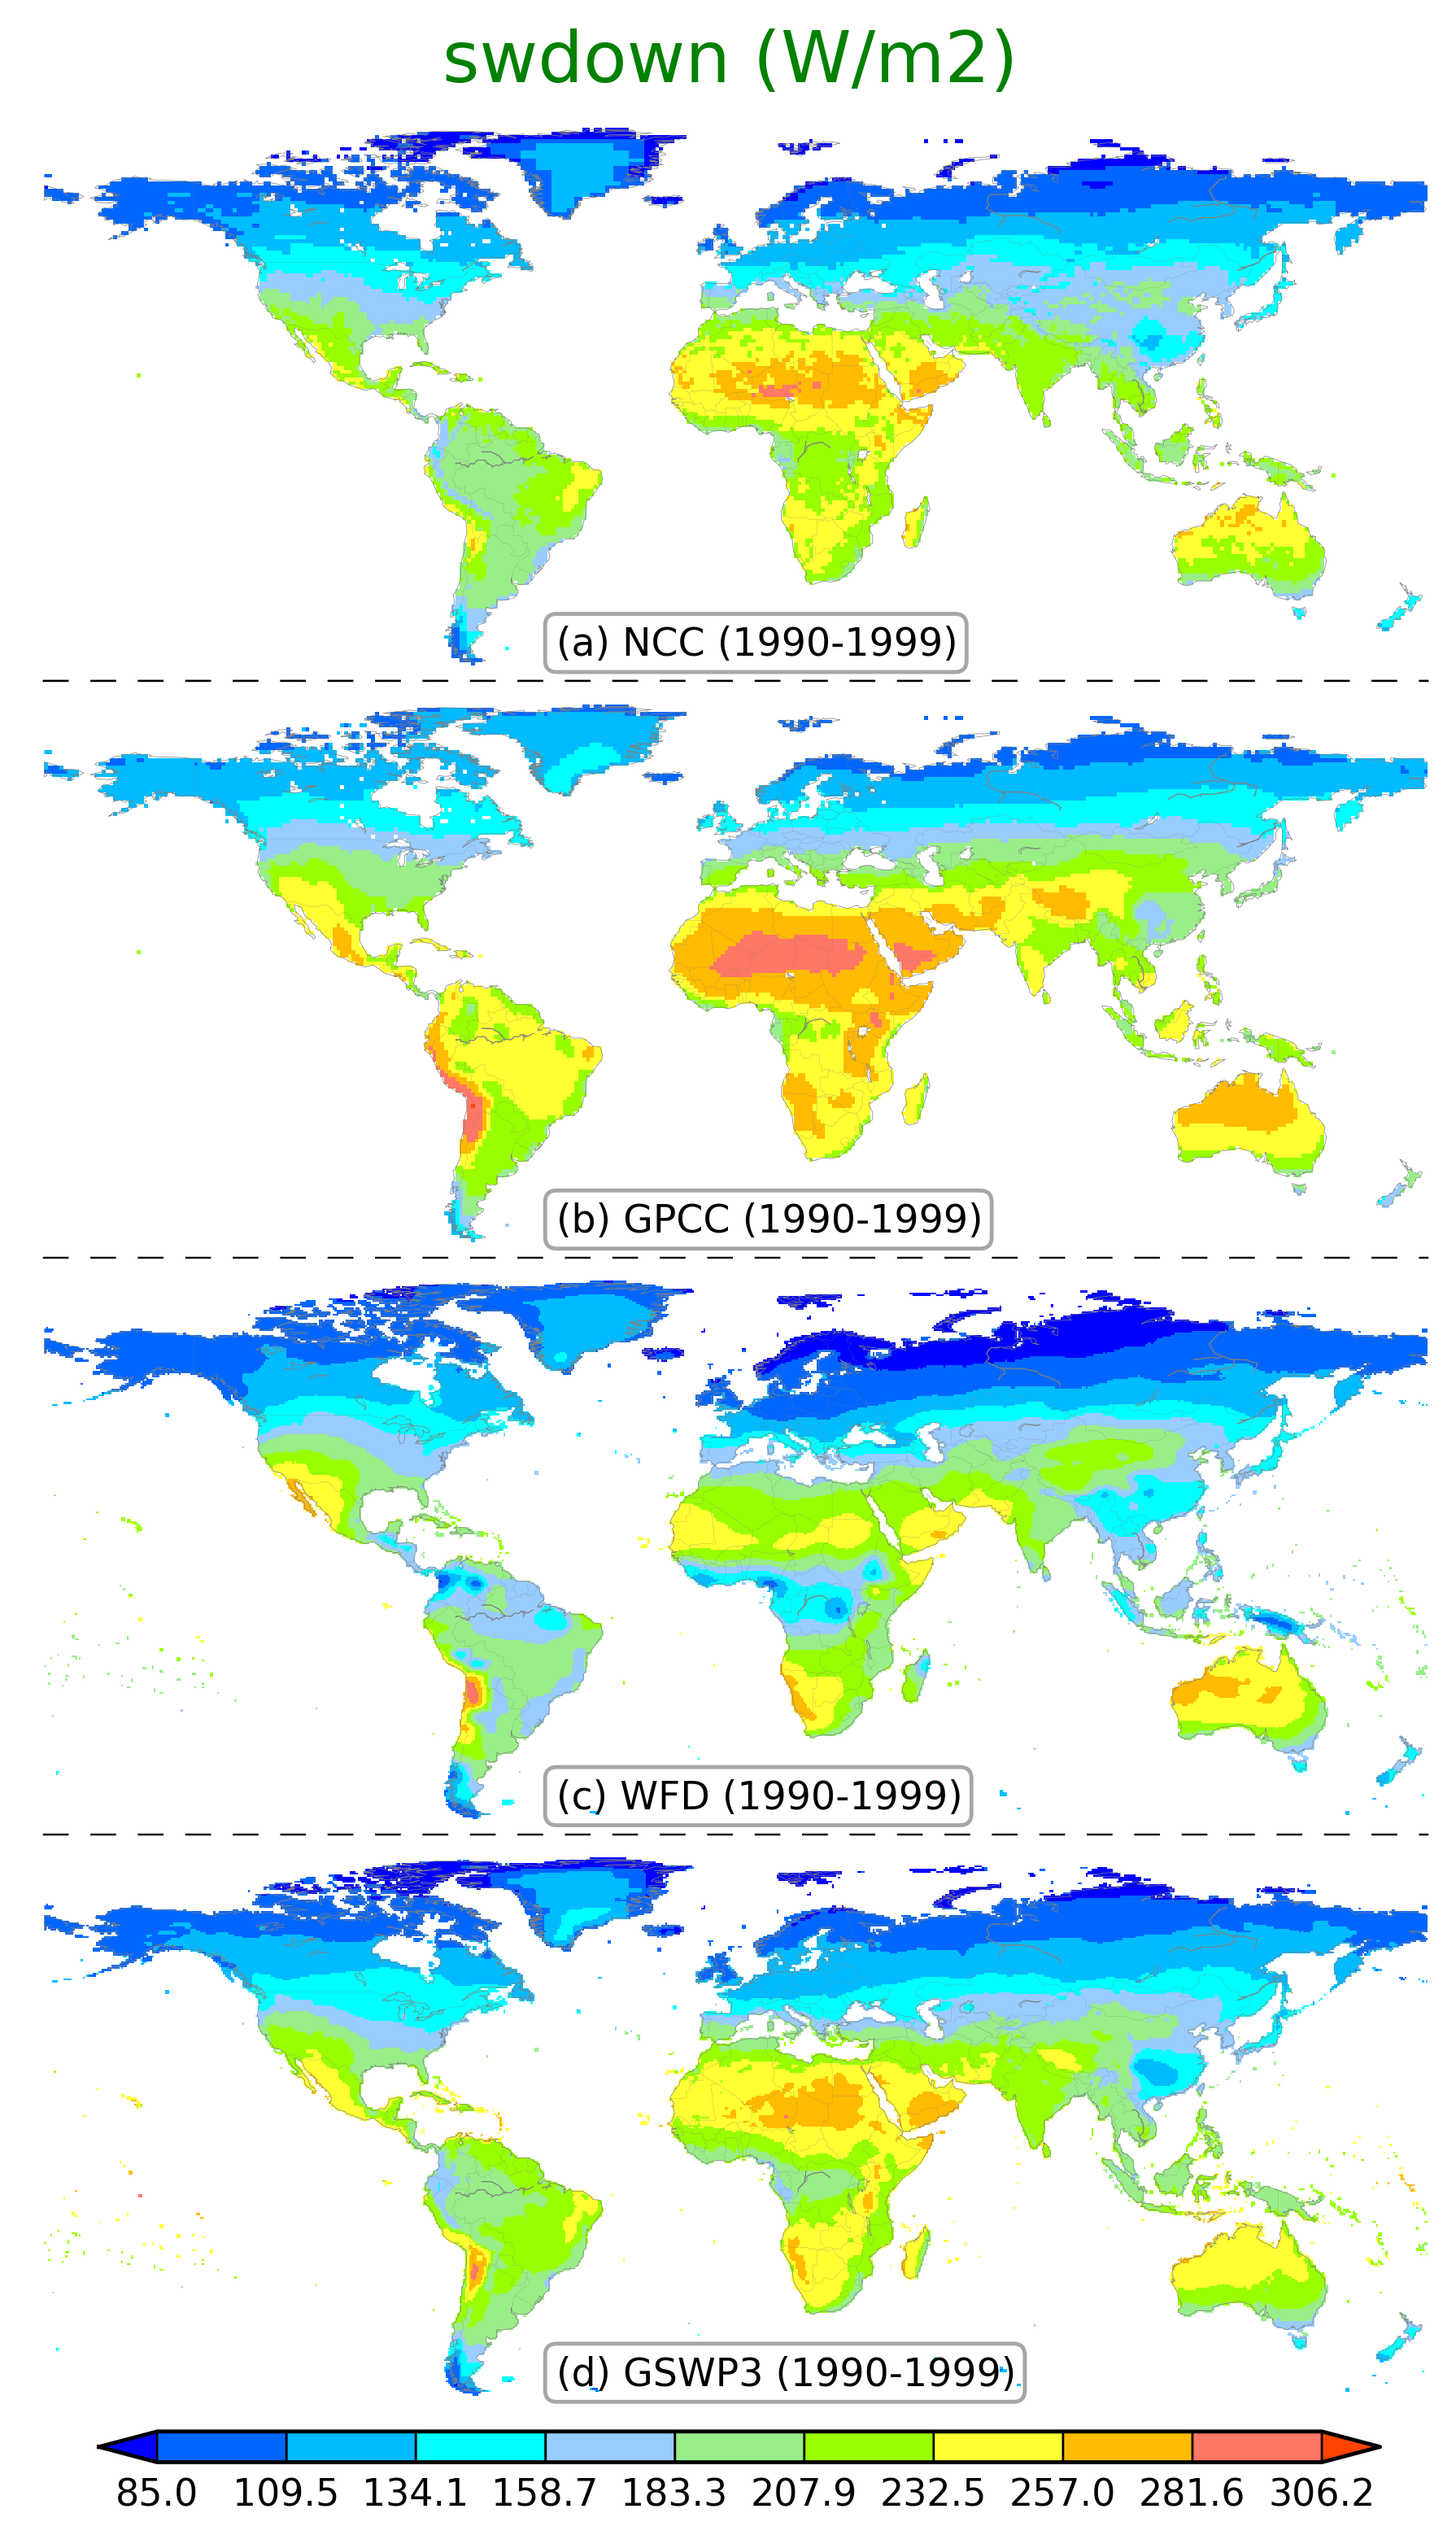 Shortwave Radiation |
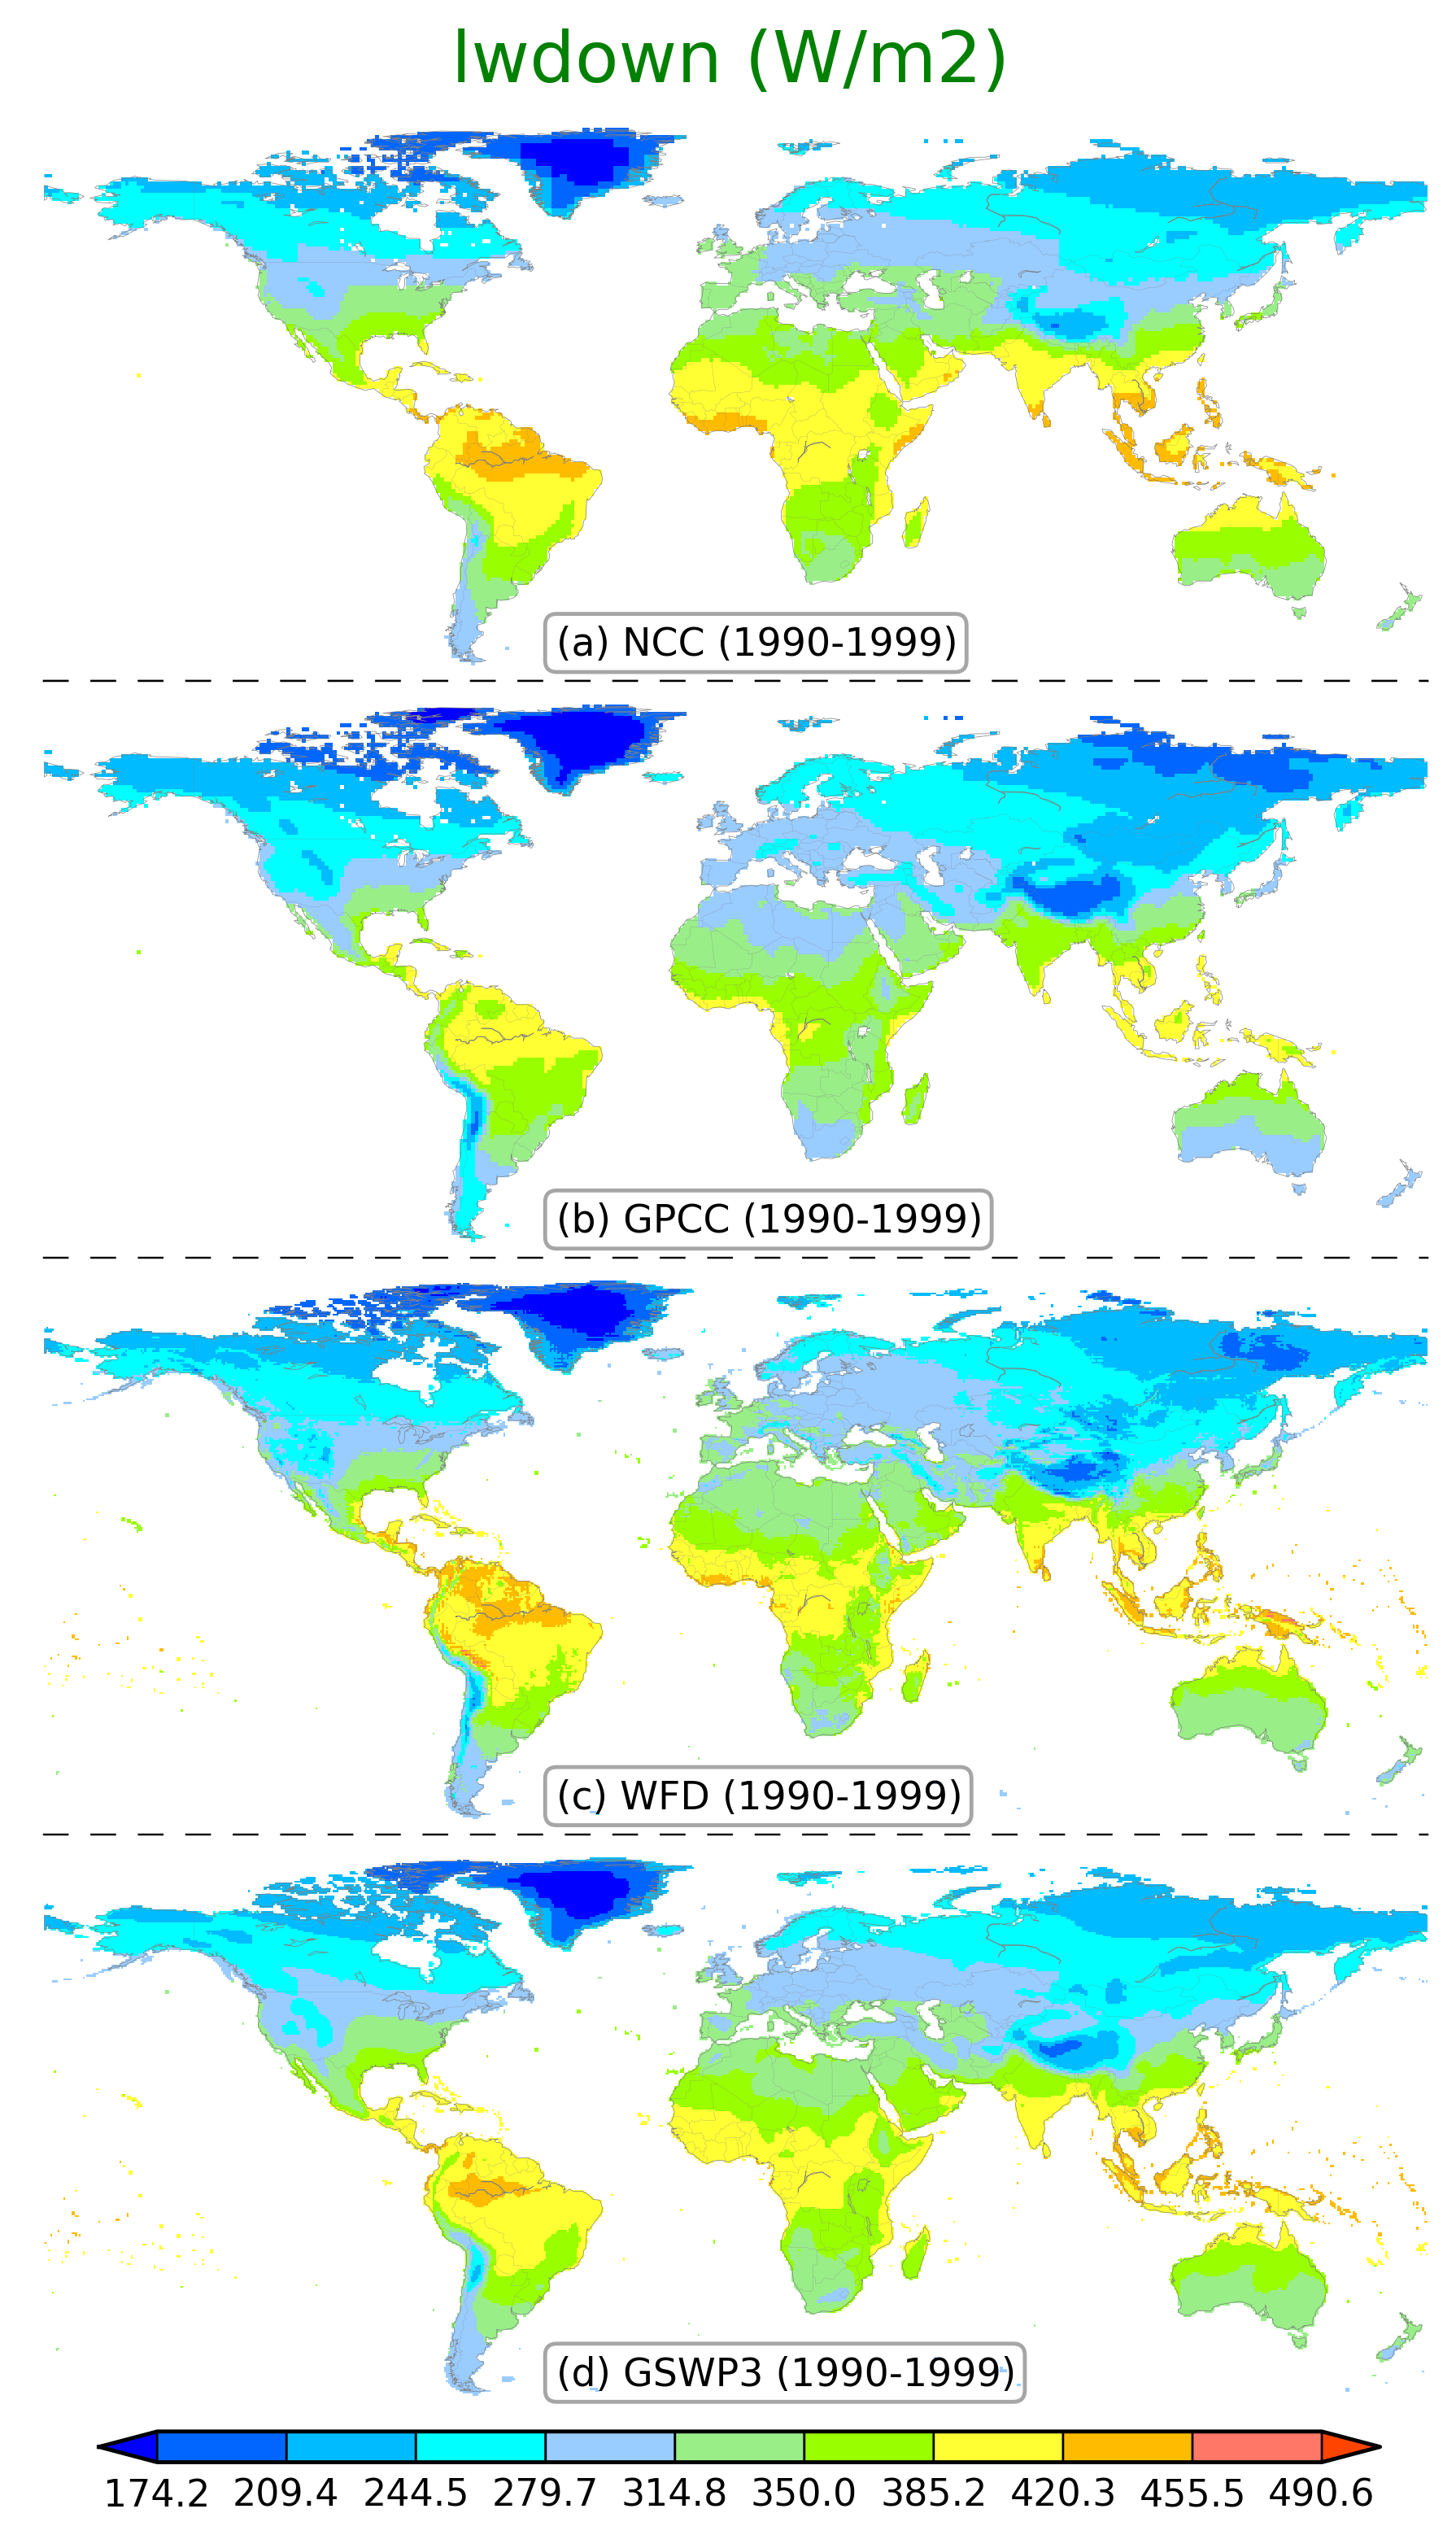 Longwave Radiation |
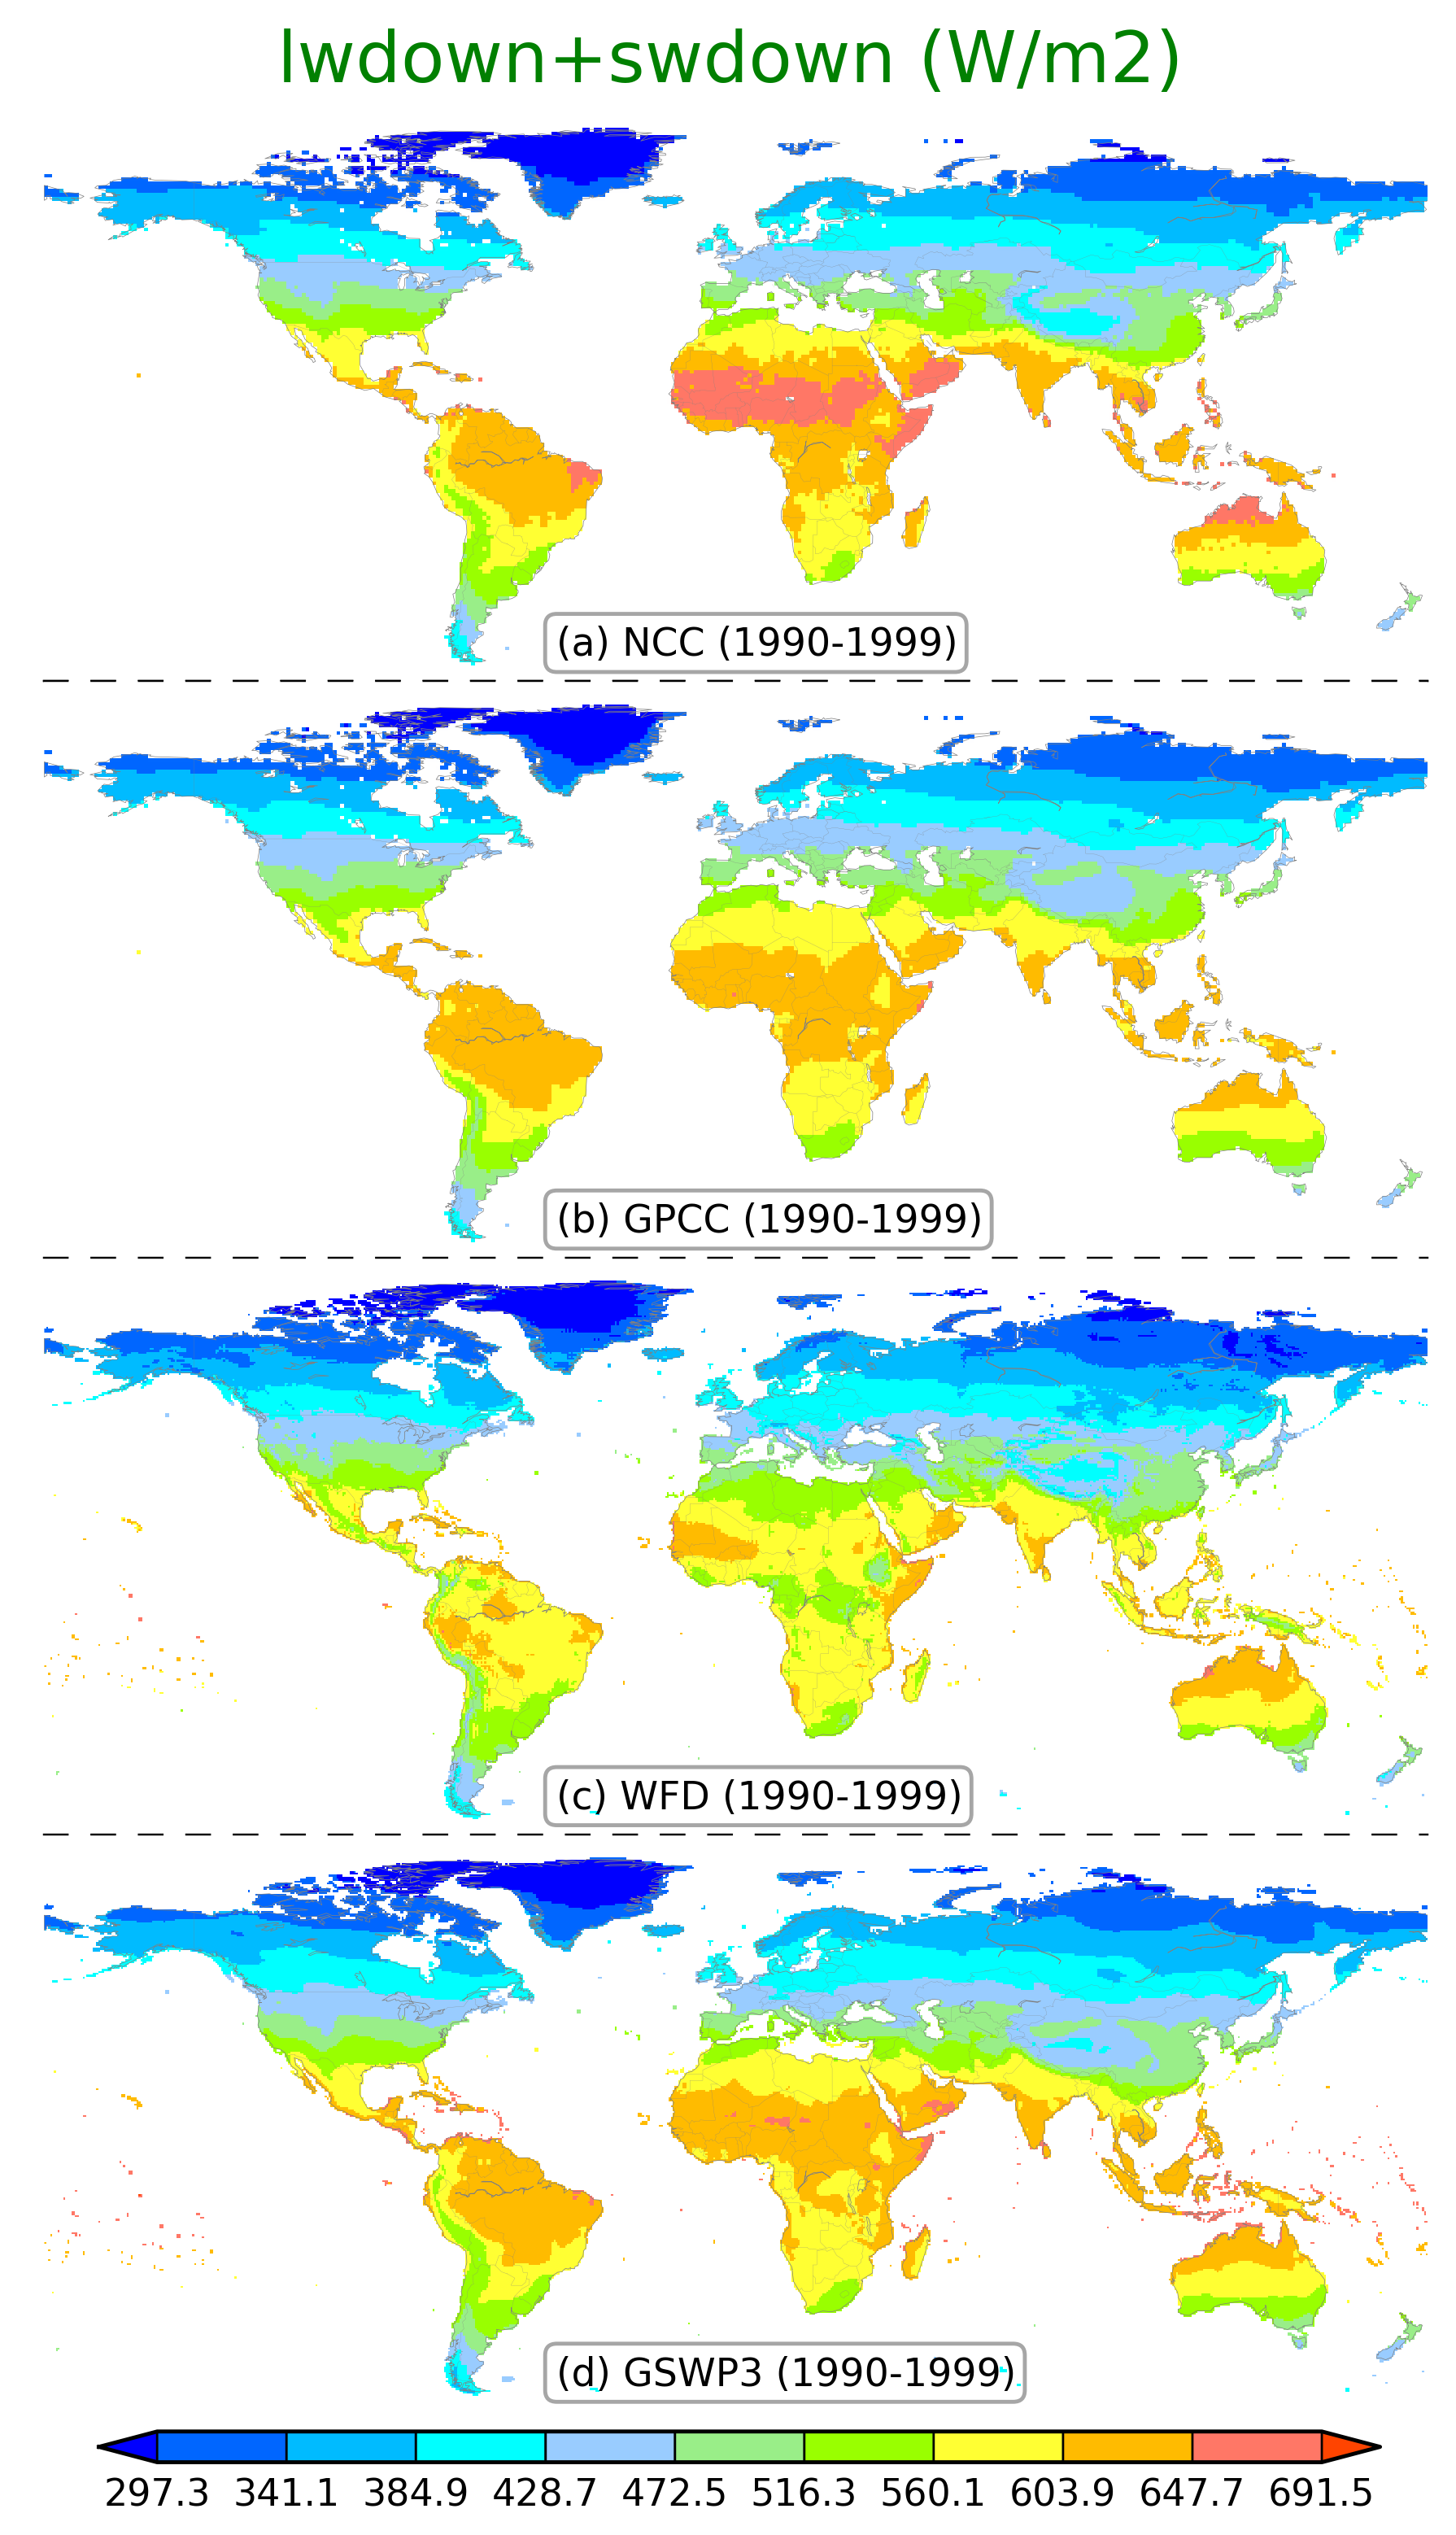 Total Downward Radiation |
Comparison of Global Simulations:
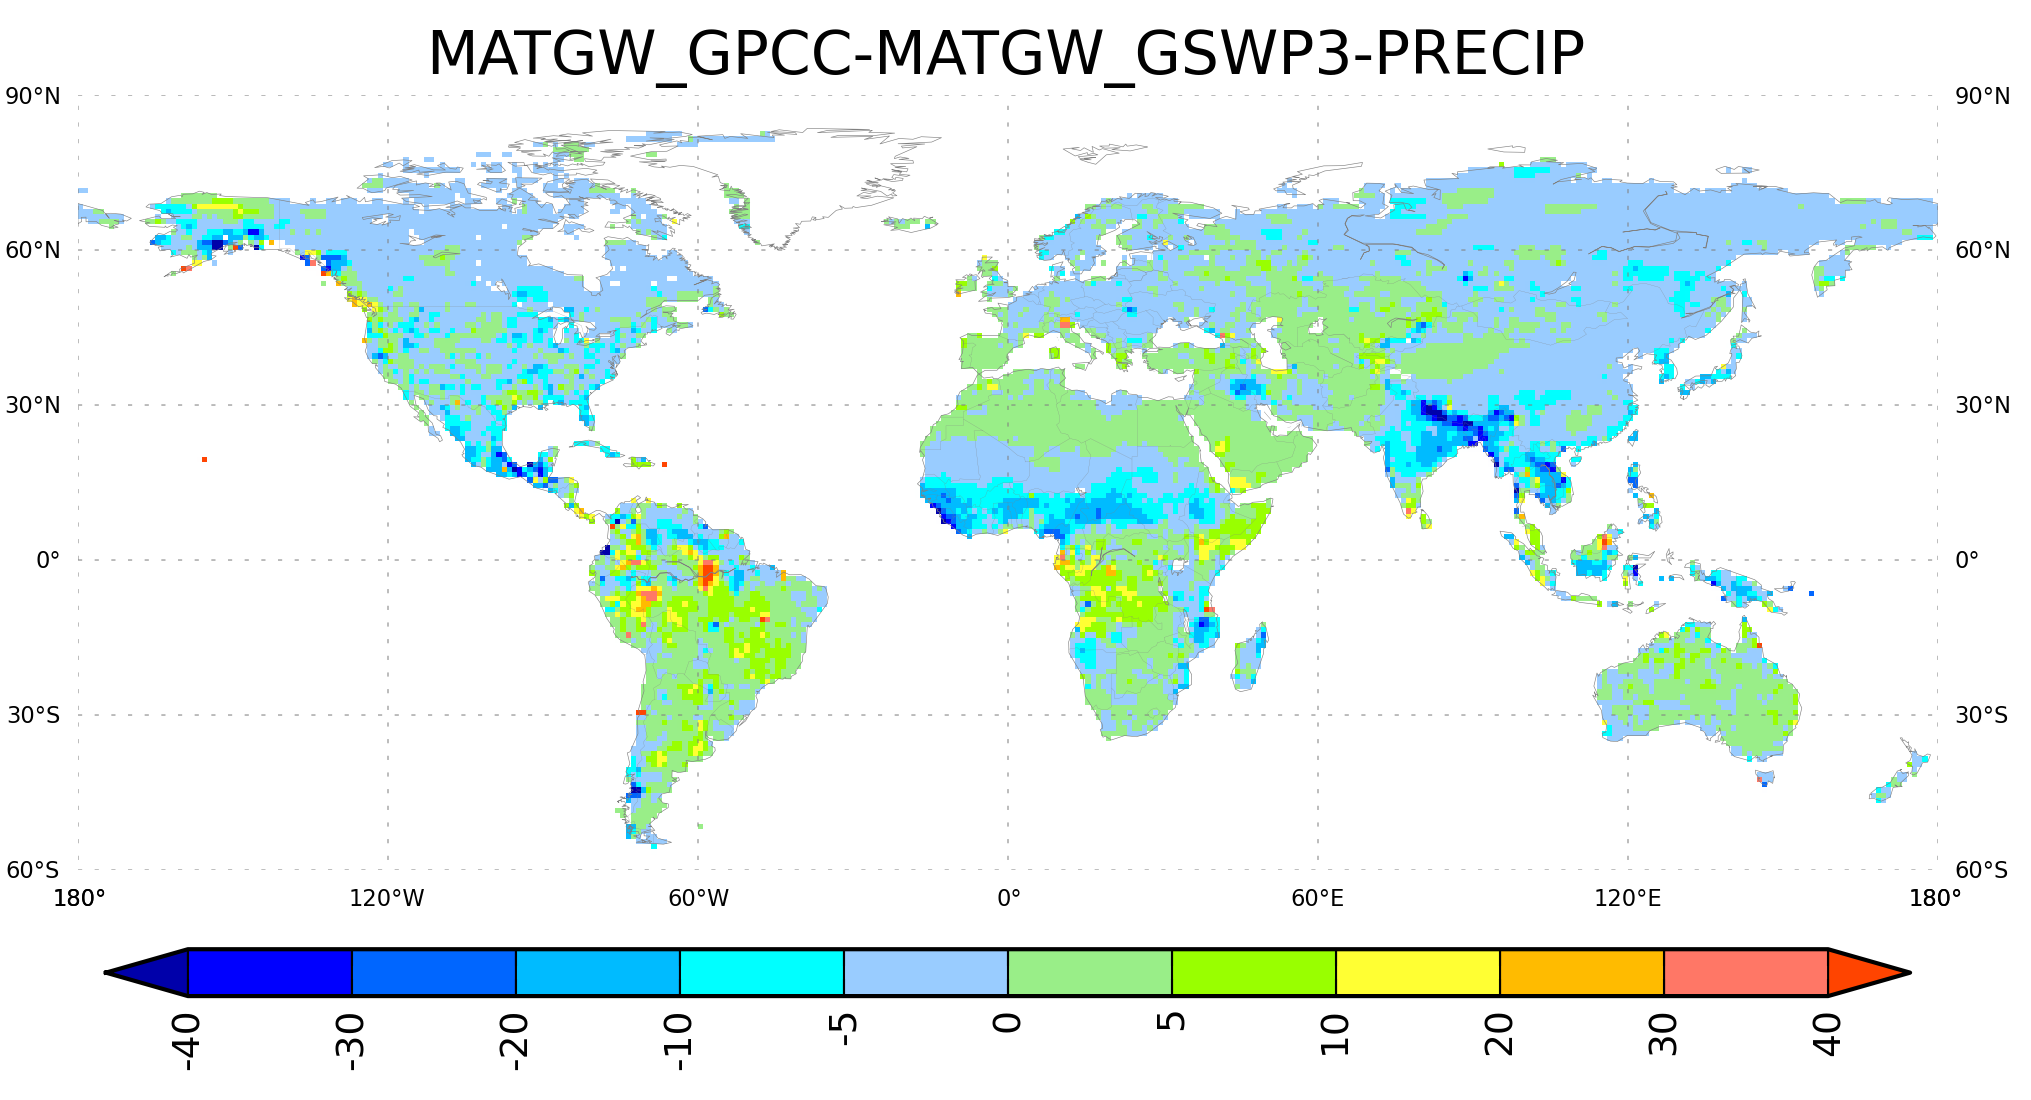
This section presents the comparison of simulations using the GPCC based forcing dataset and GSWP3 beta forcing dataset. The figures are the difference.Model: MATSIRO with groundwater representation.
Time period: 2000-2007 inclusive
Spatial resolution: 1 deg
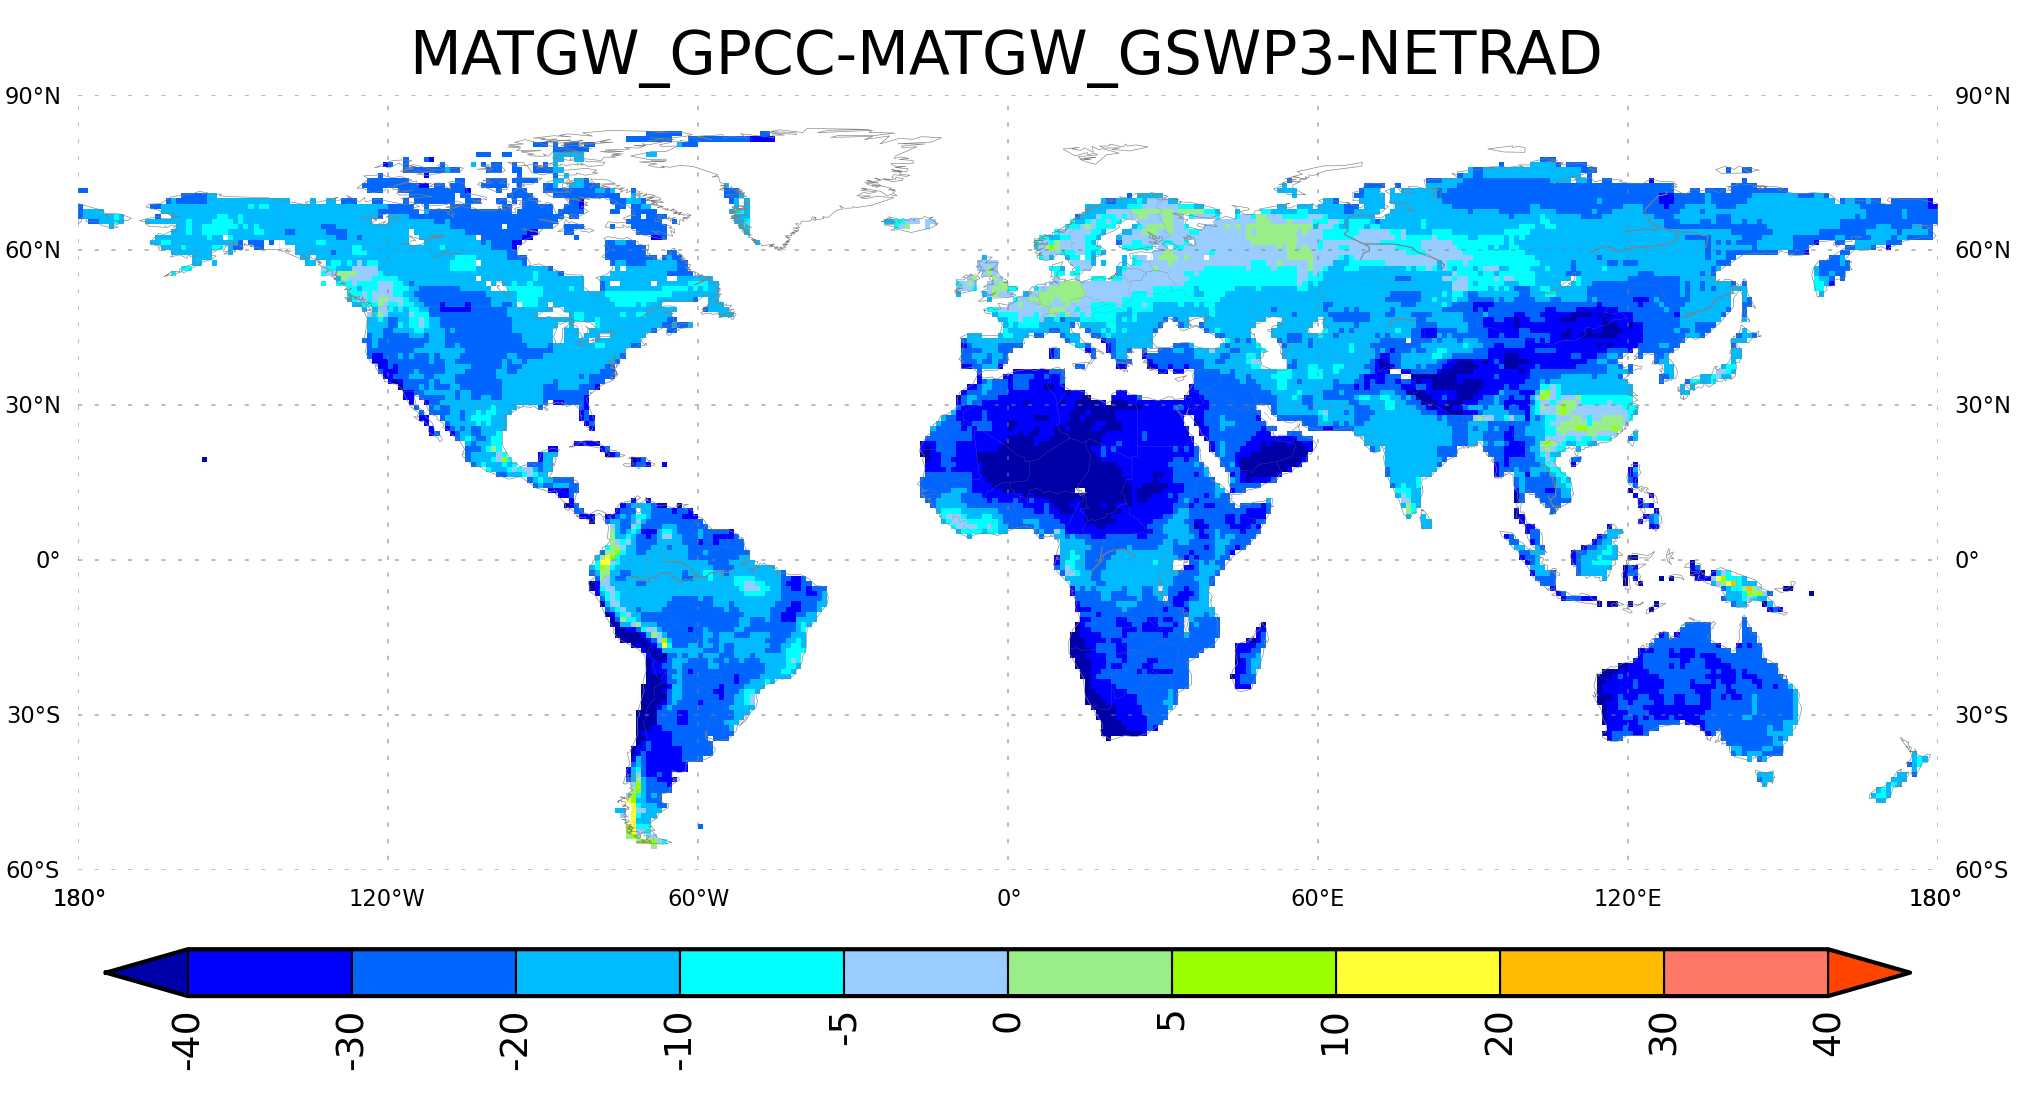


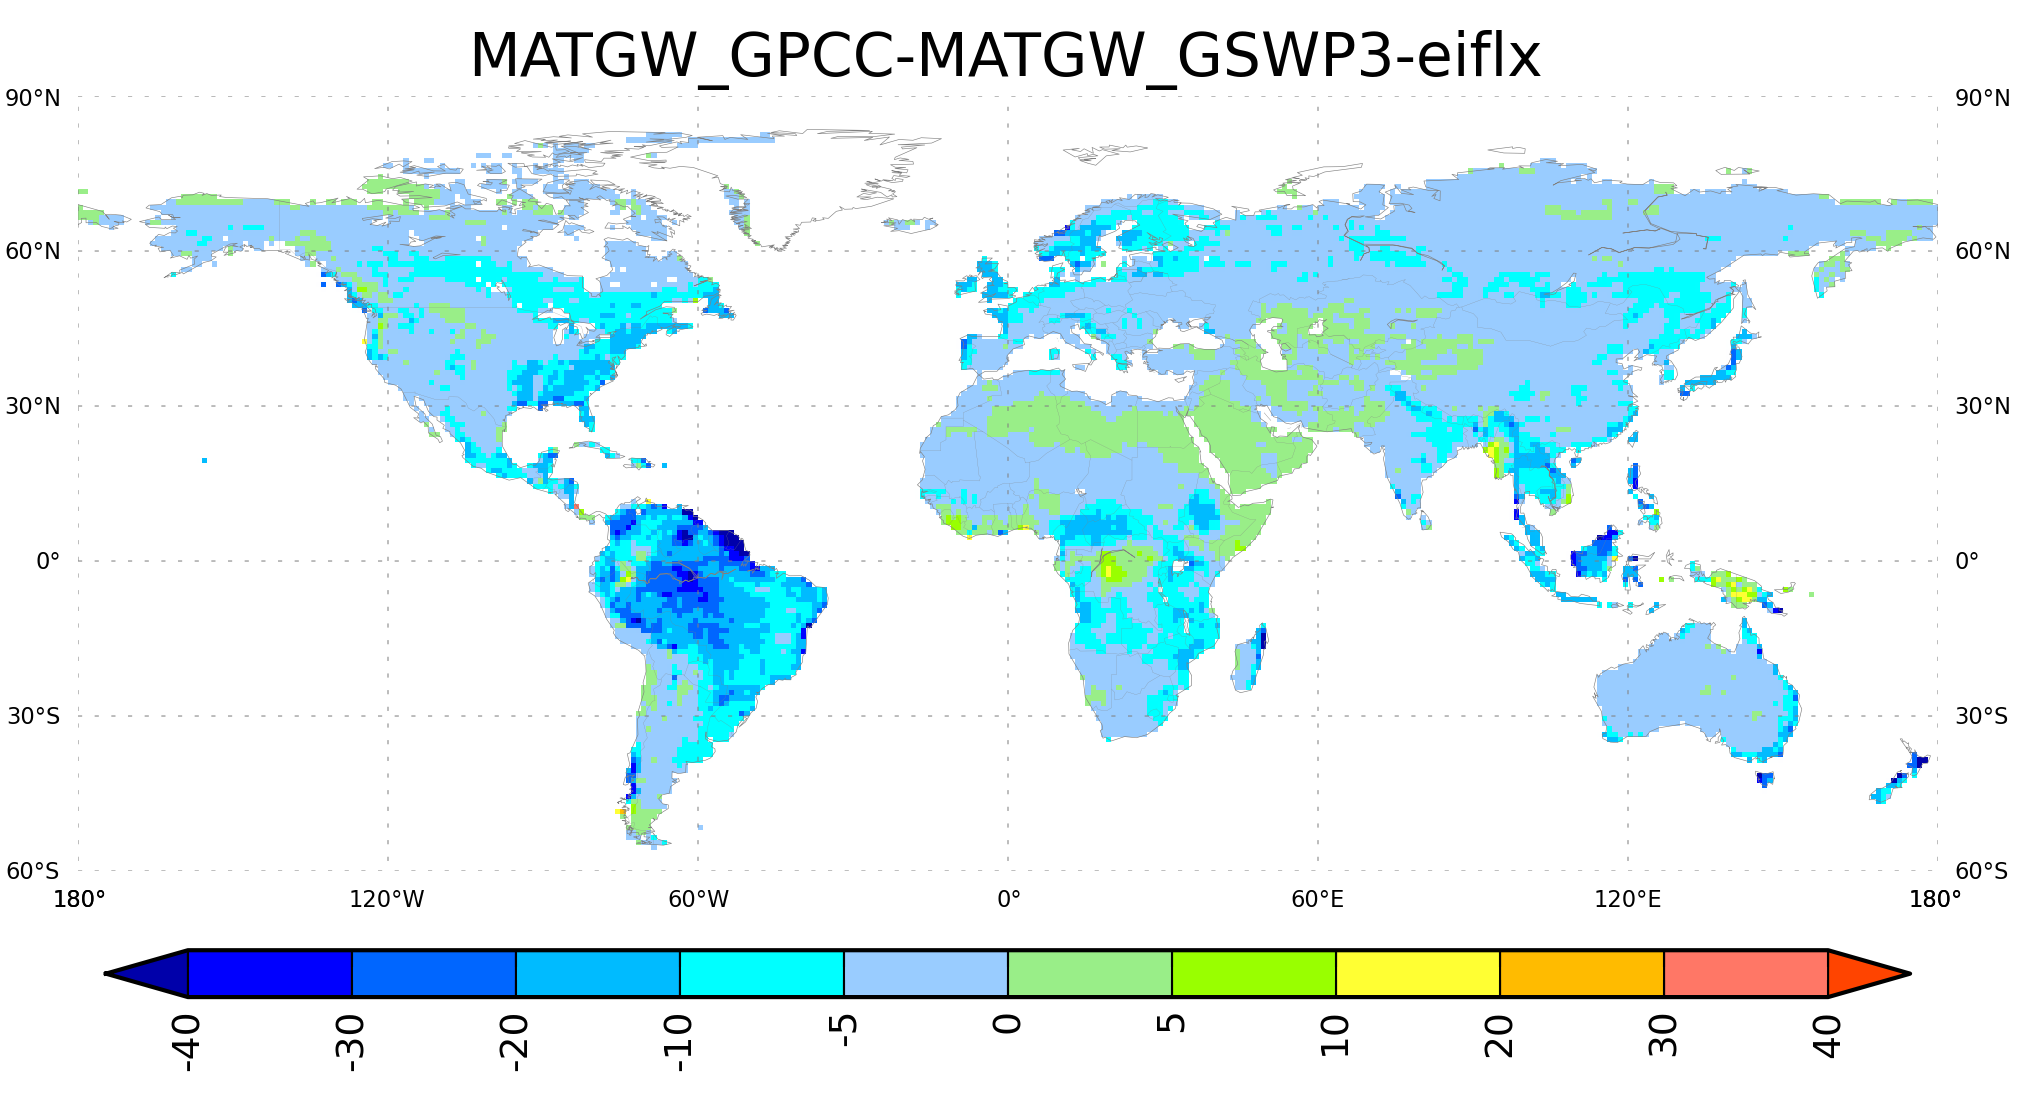
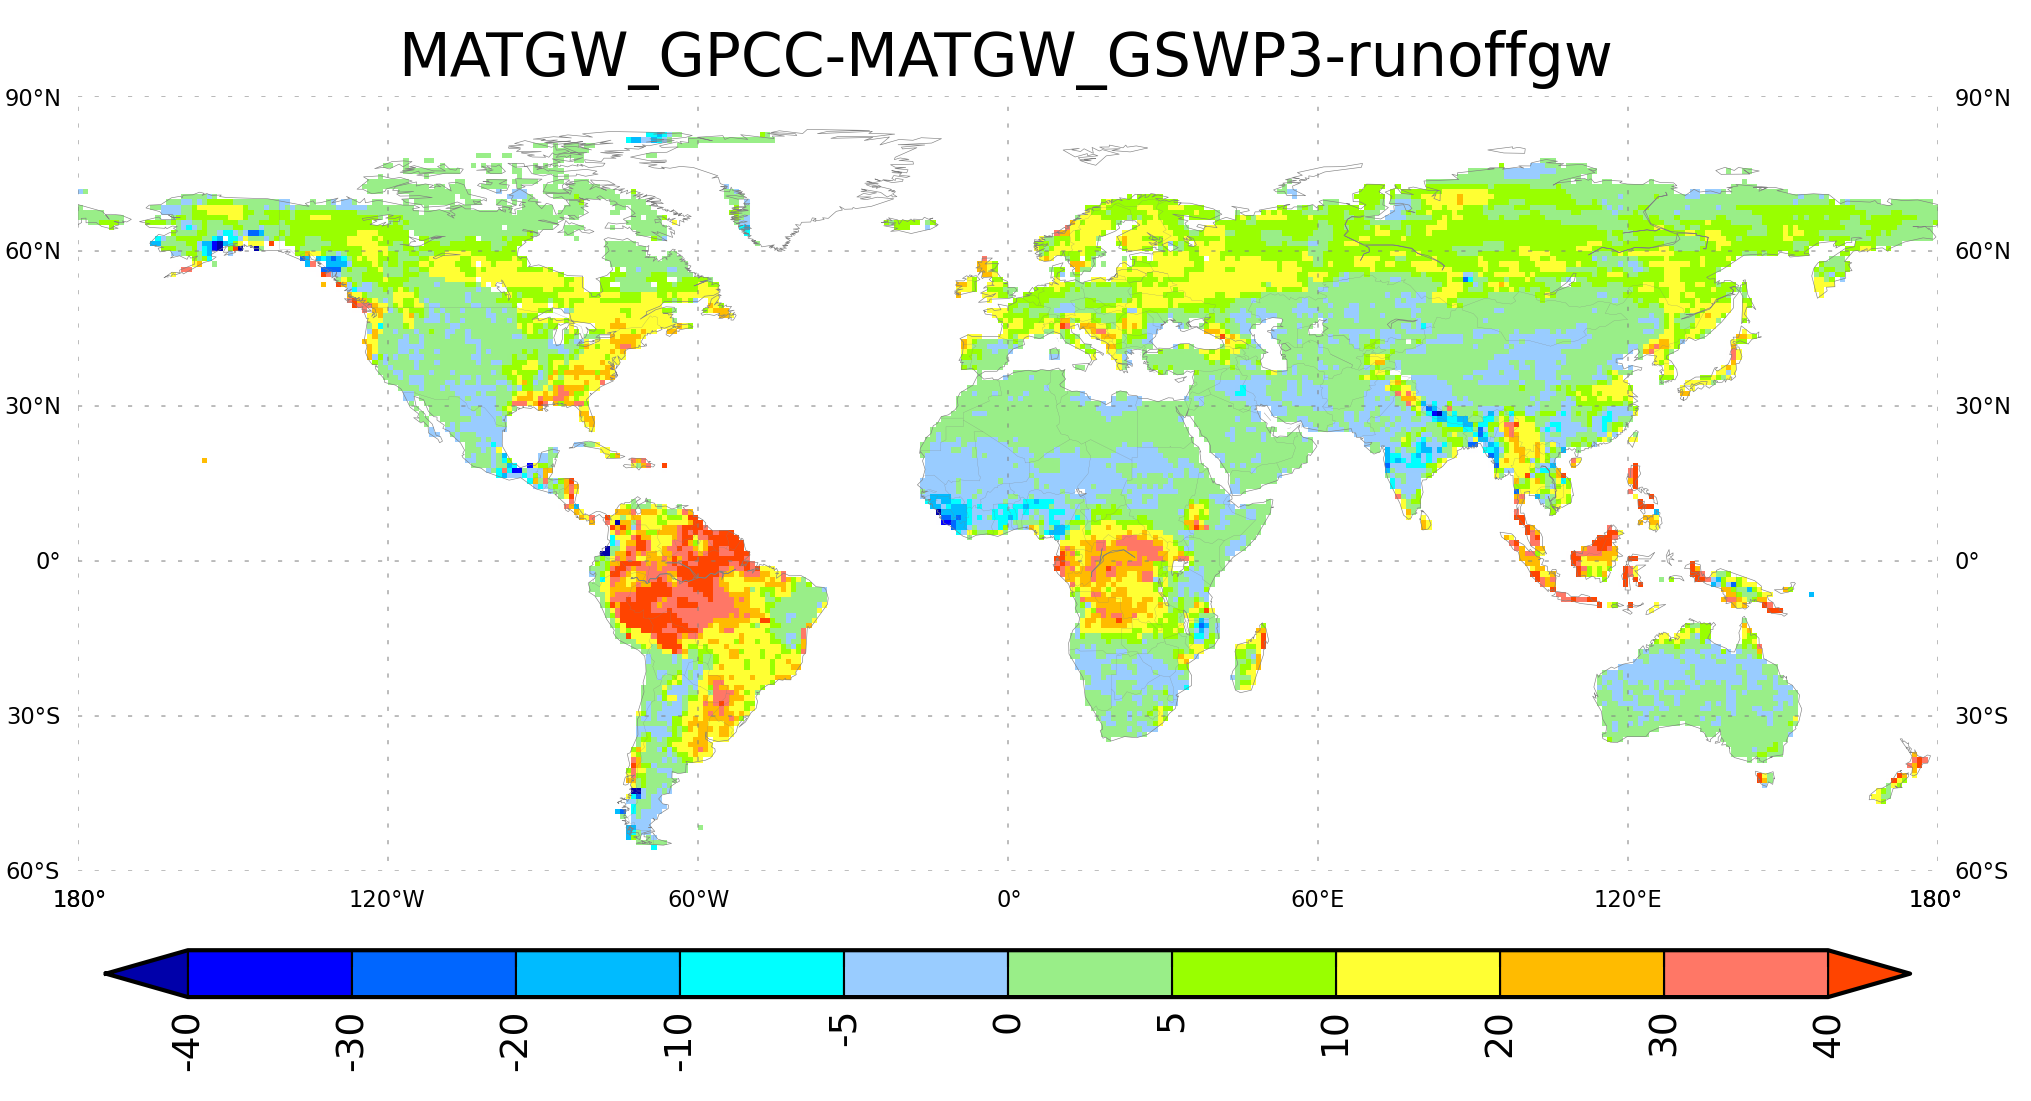
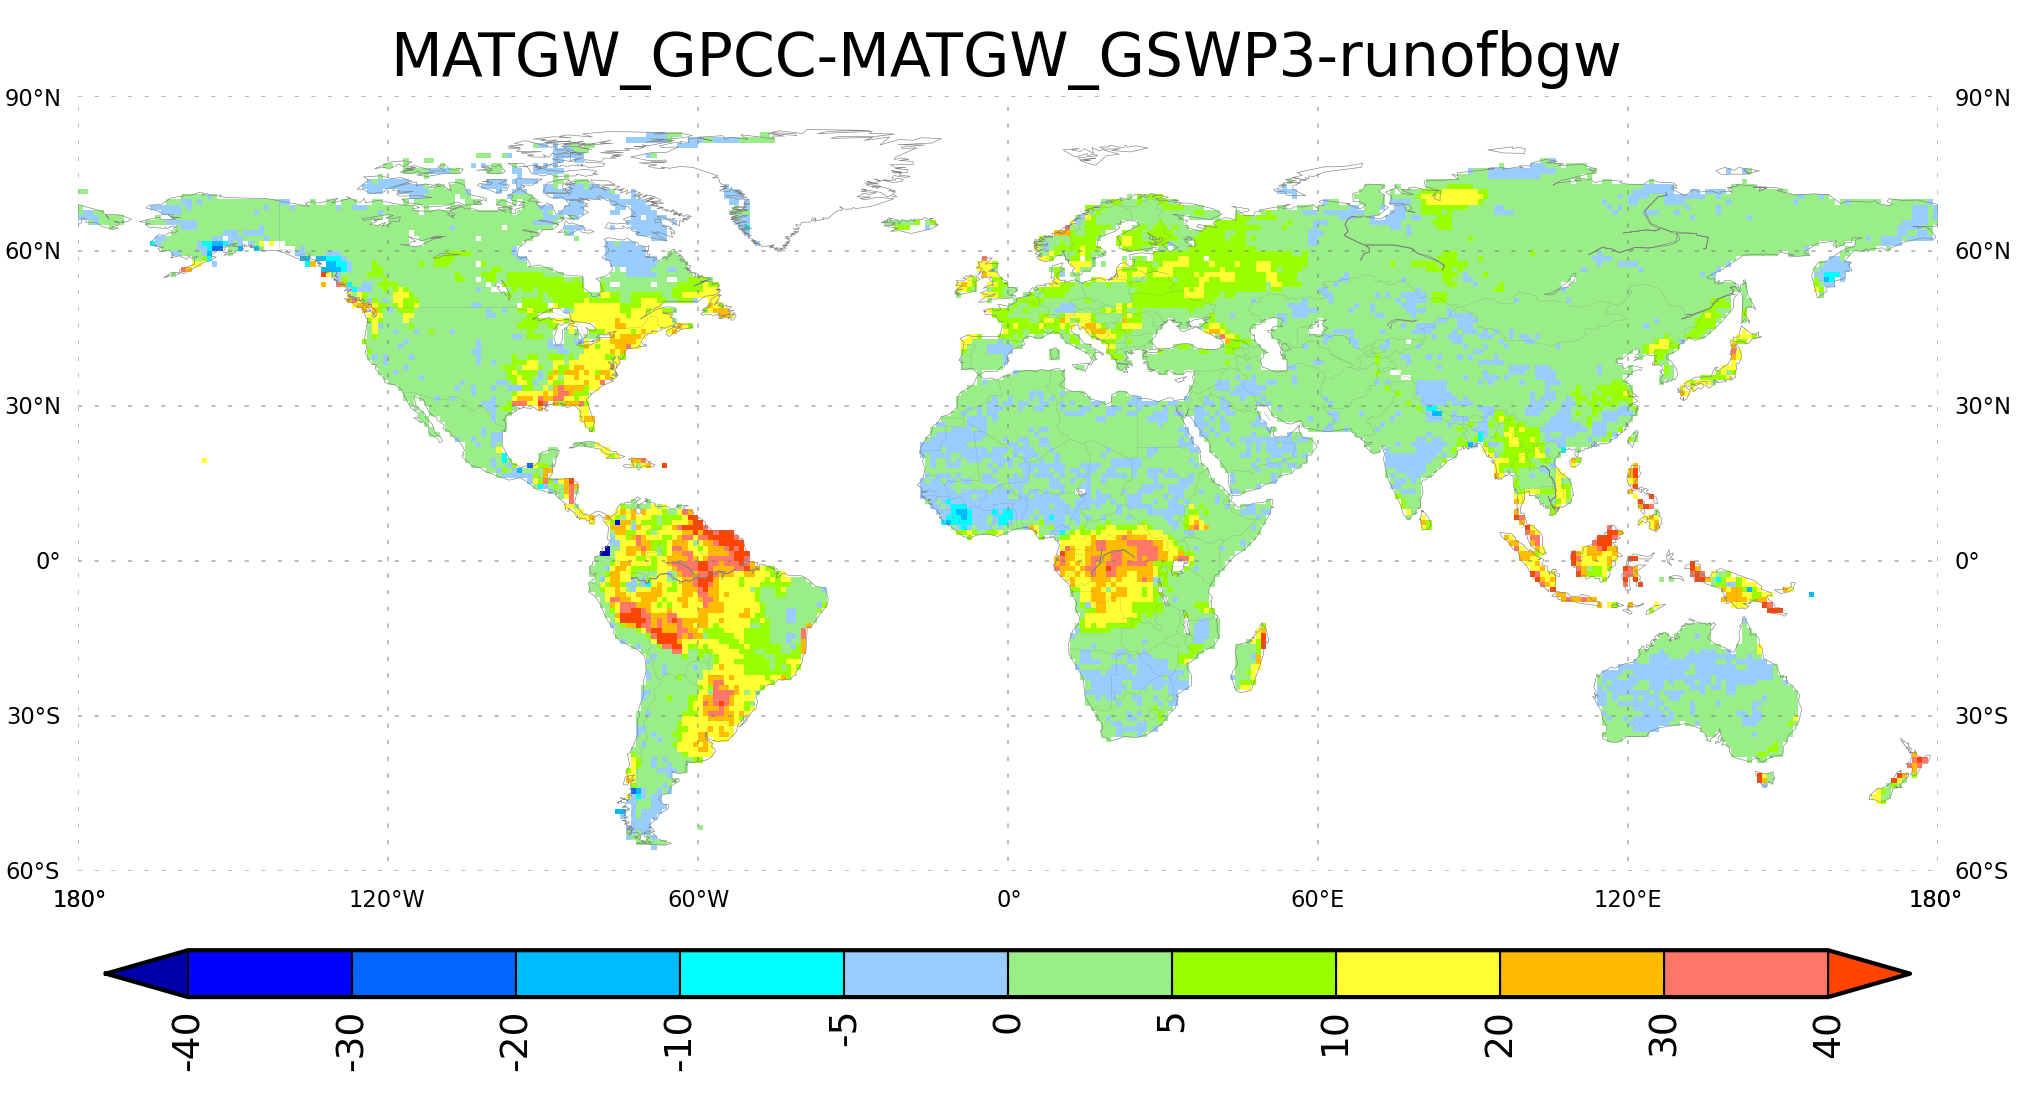
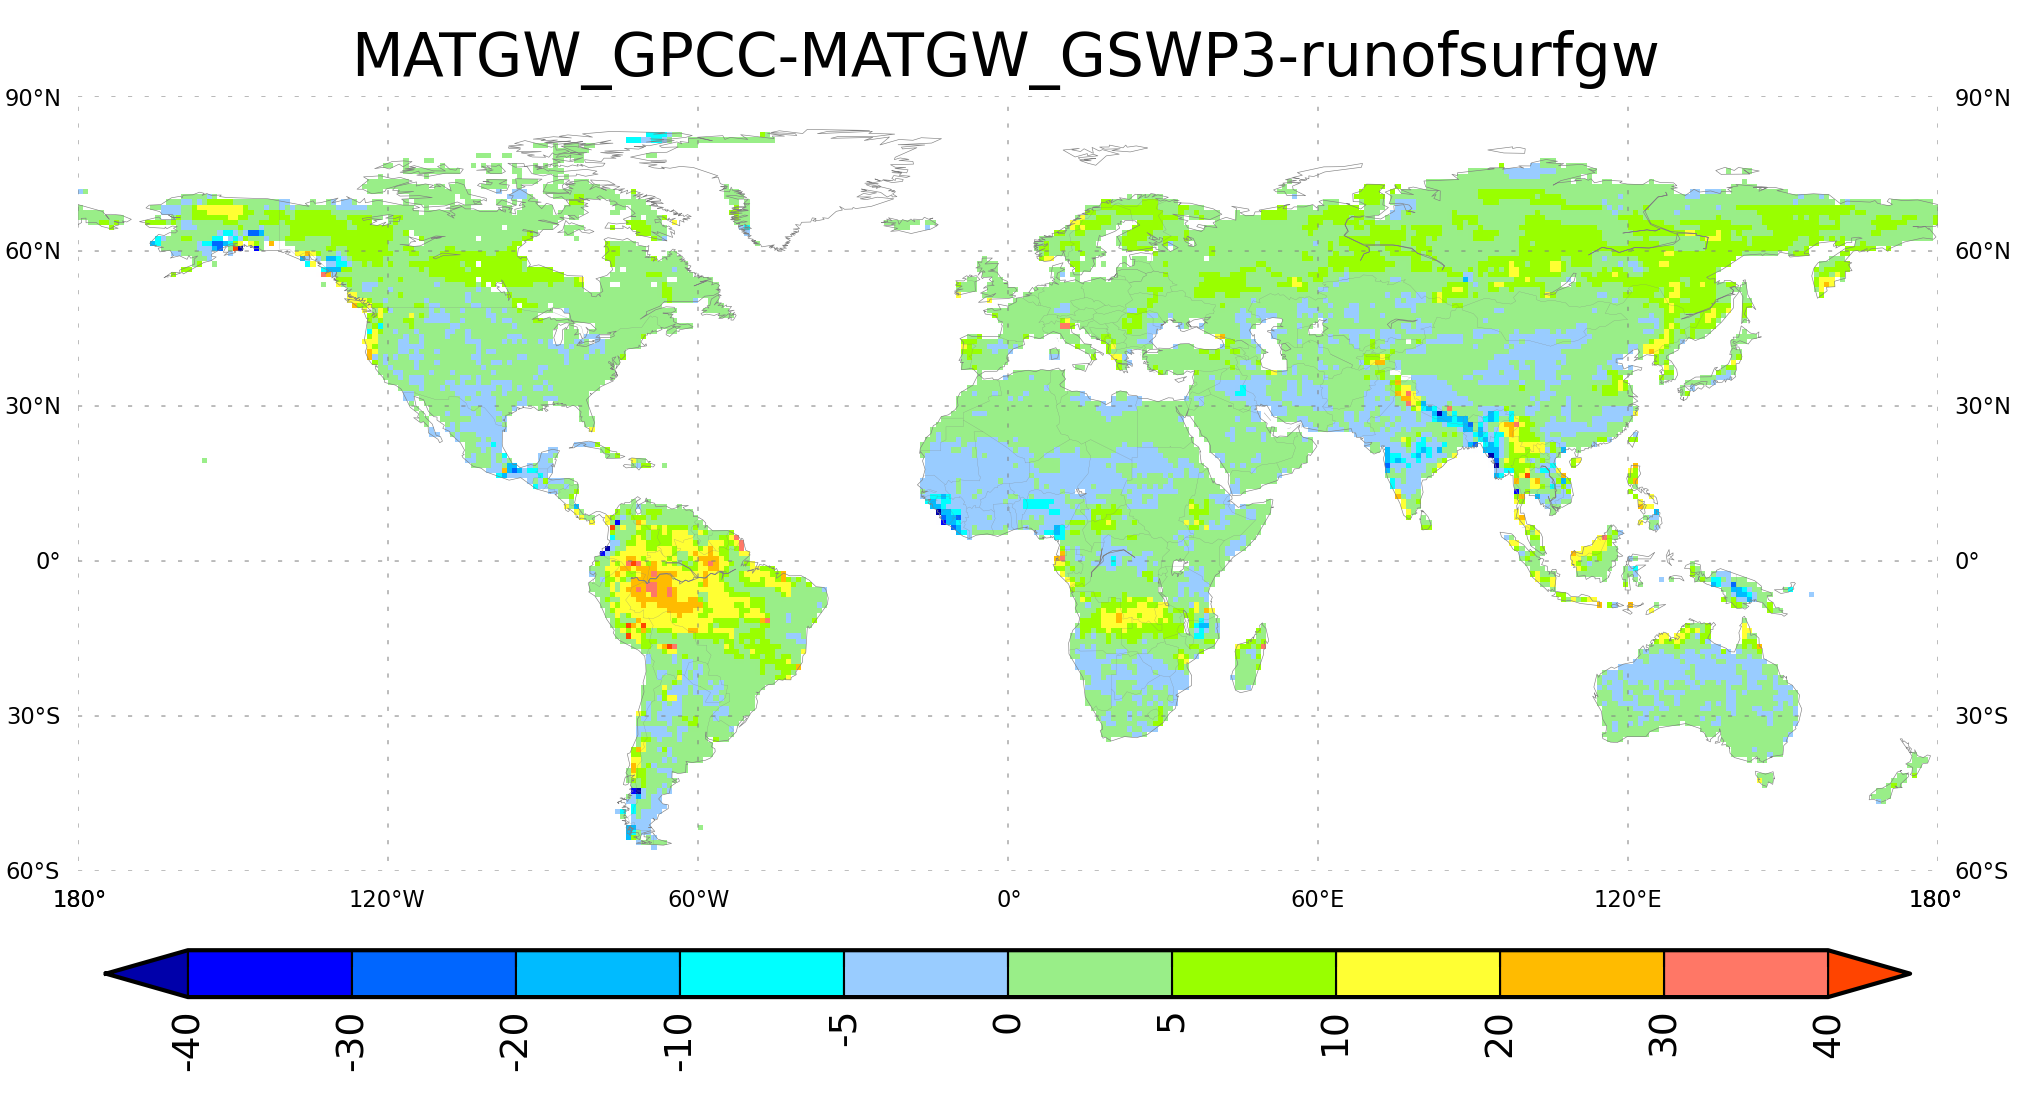
Evapotranspiration and Related Variables:
Since, the ET is significantly higher for GSWP3 compared to GPCC, a comparison of ET to precipitation ratio for simulations using NCC (1985-1999), GPCC (1979-2007), WFD (1958-2001), and GSWP3 (2000-2008) is presented here. Also, comparisons of LW down and SW down forcing for the same periods are also presented.
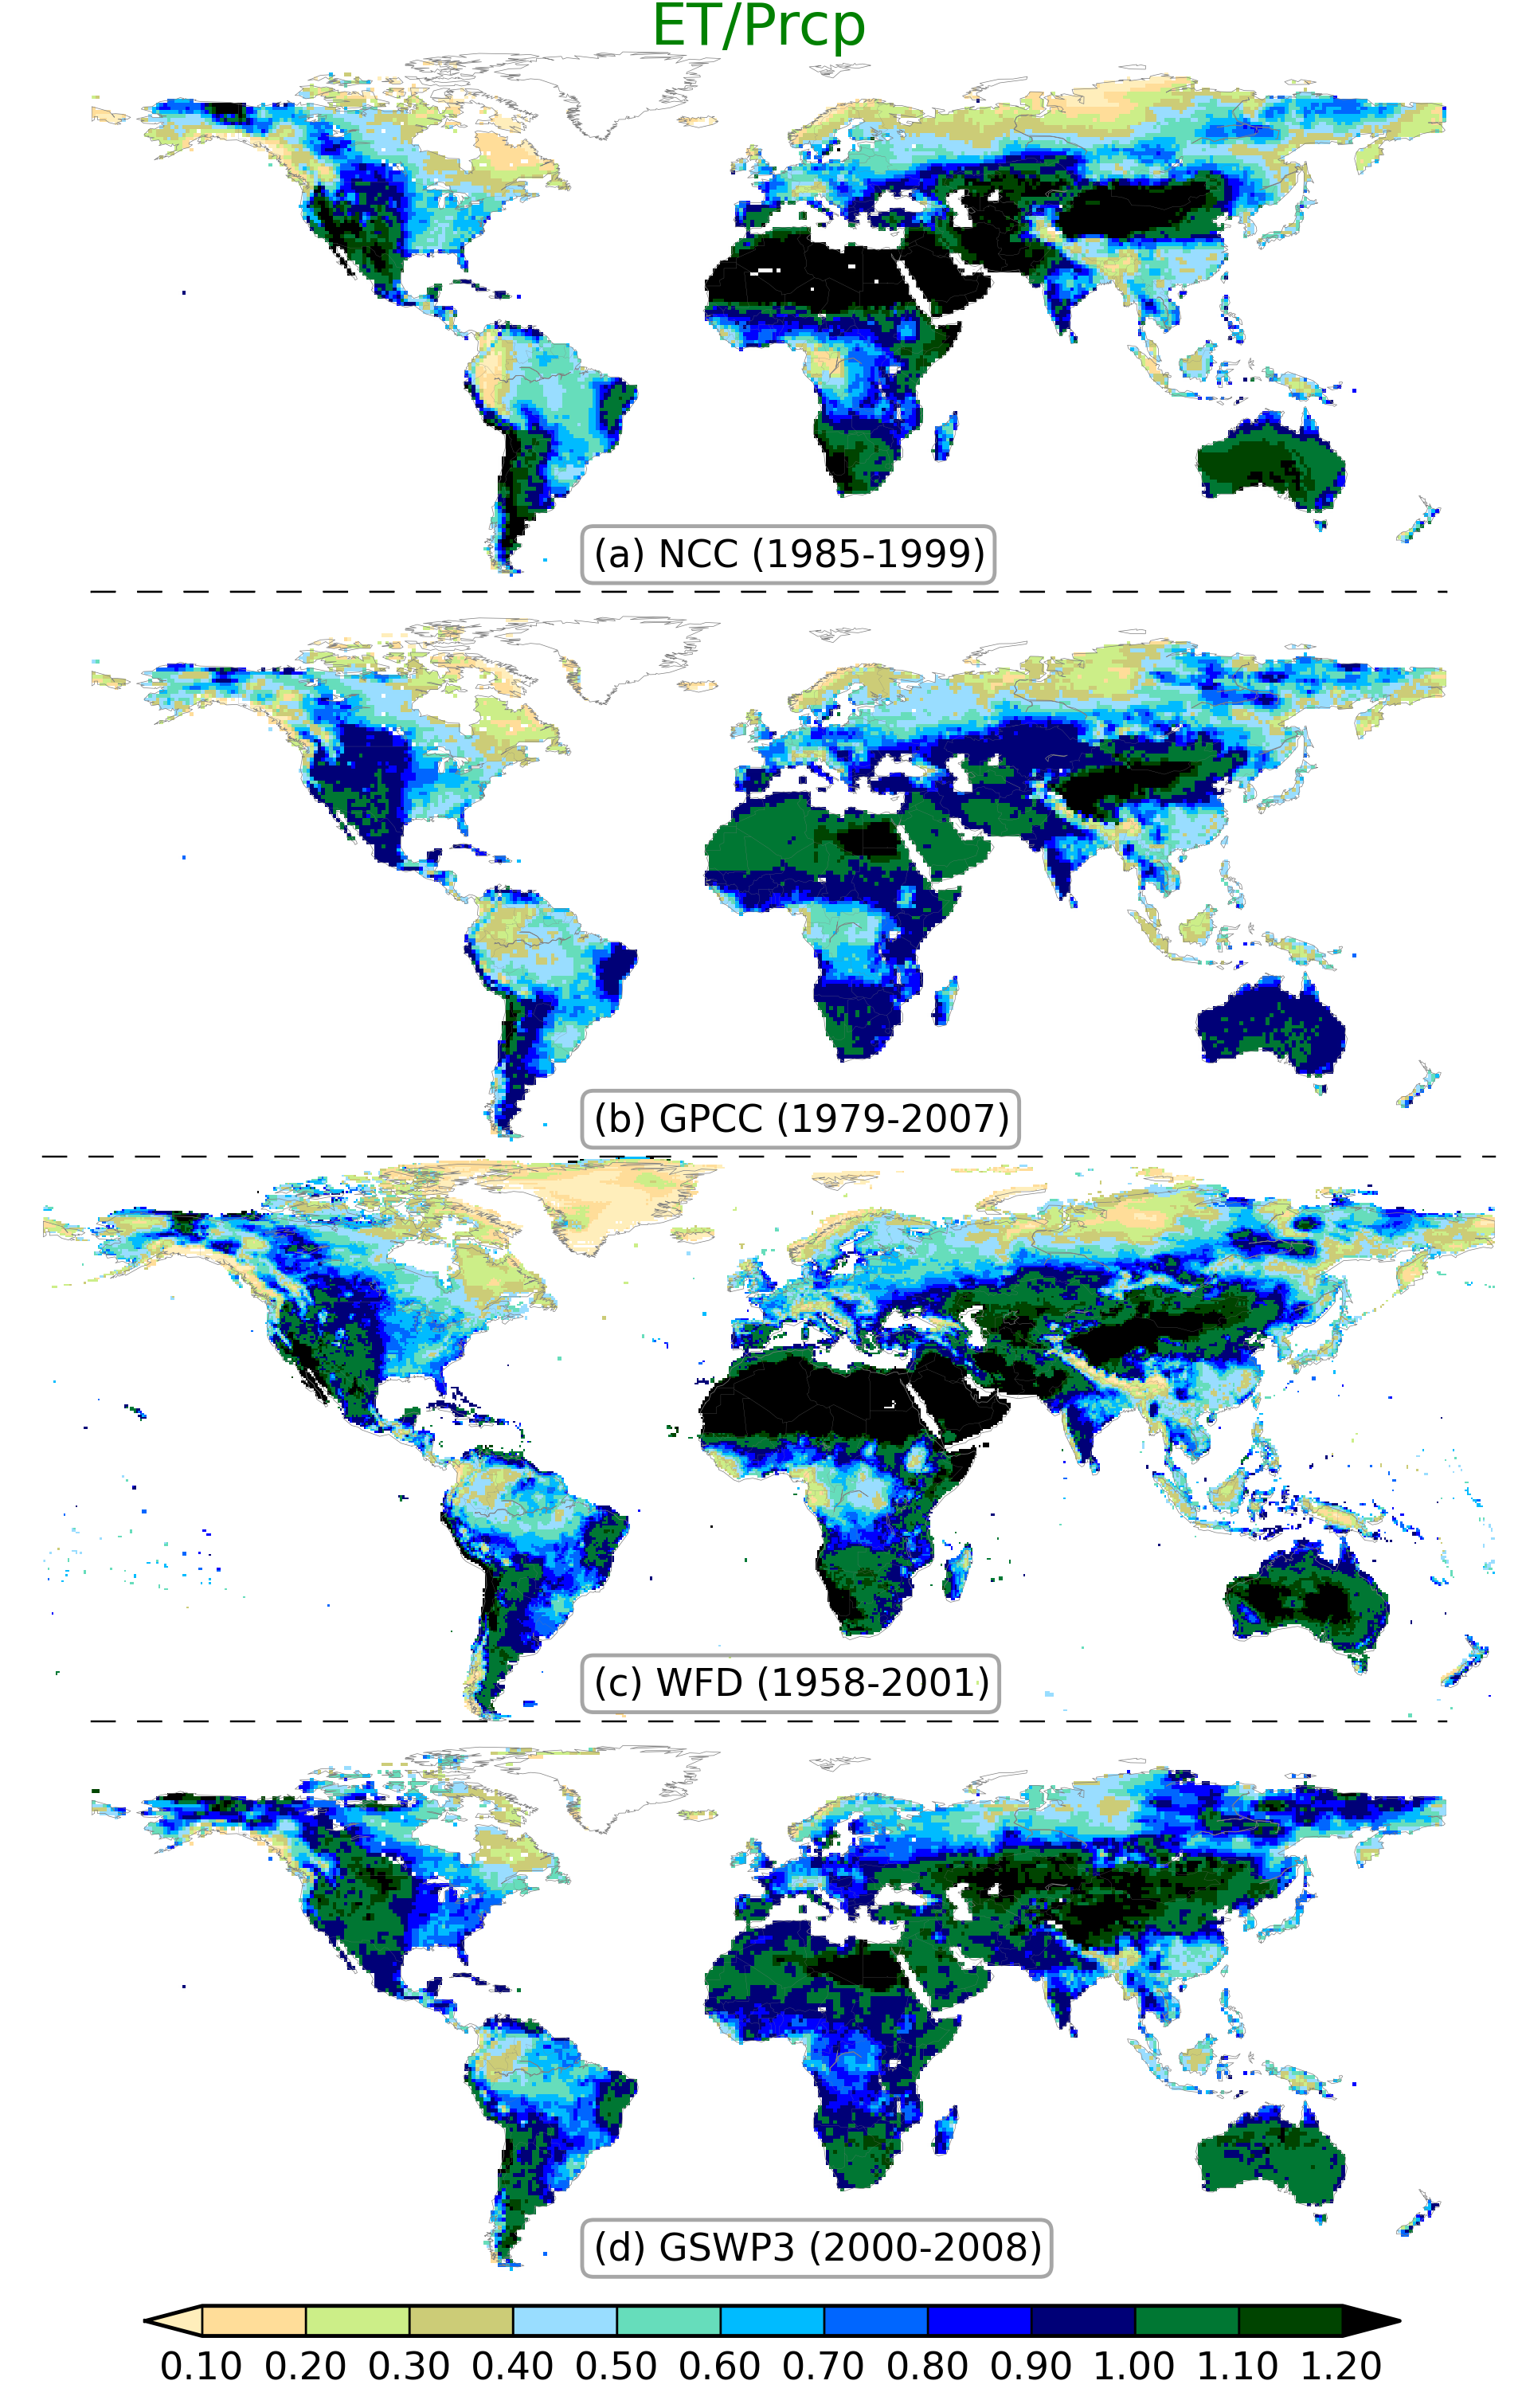 ET/Precipitation |
 LW down/ Total Downward Rad. |
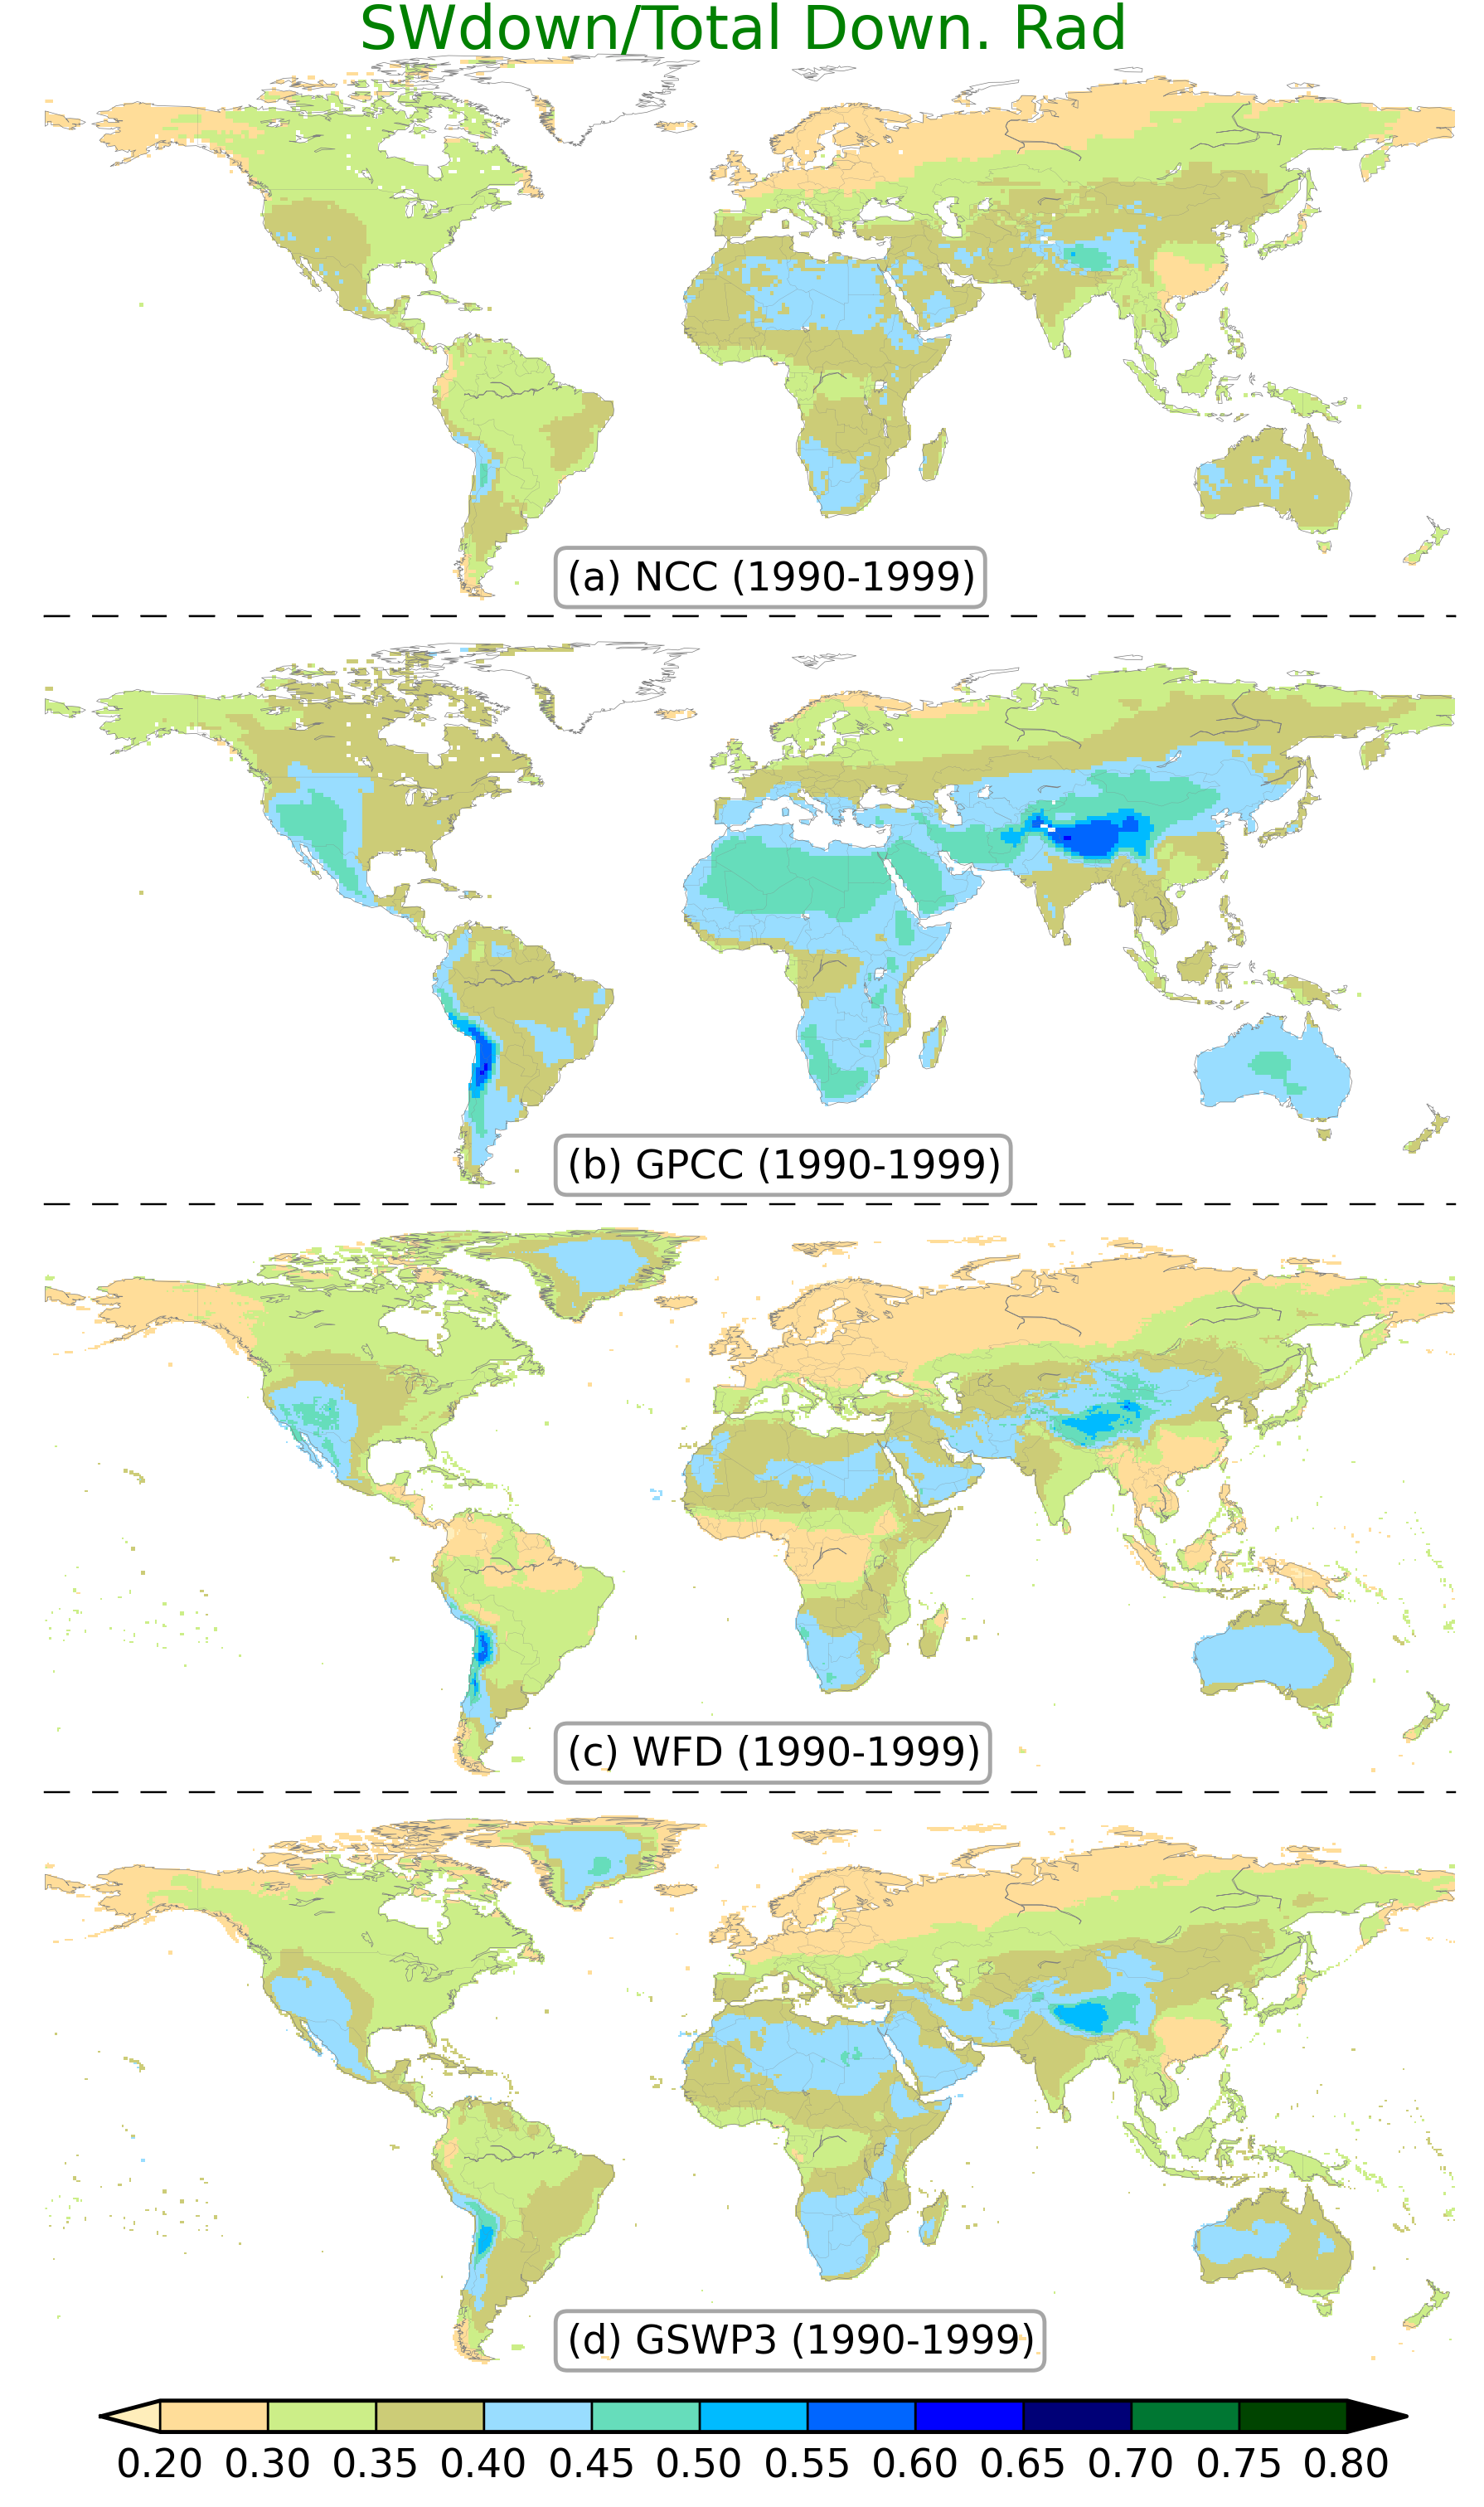 SW down/ Total Downward Rad. |
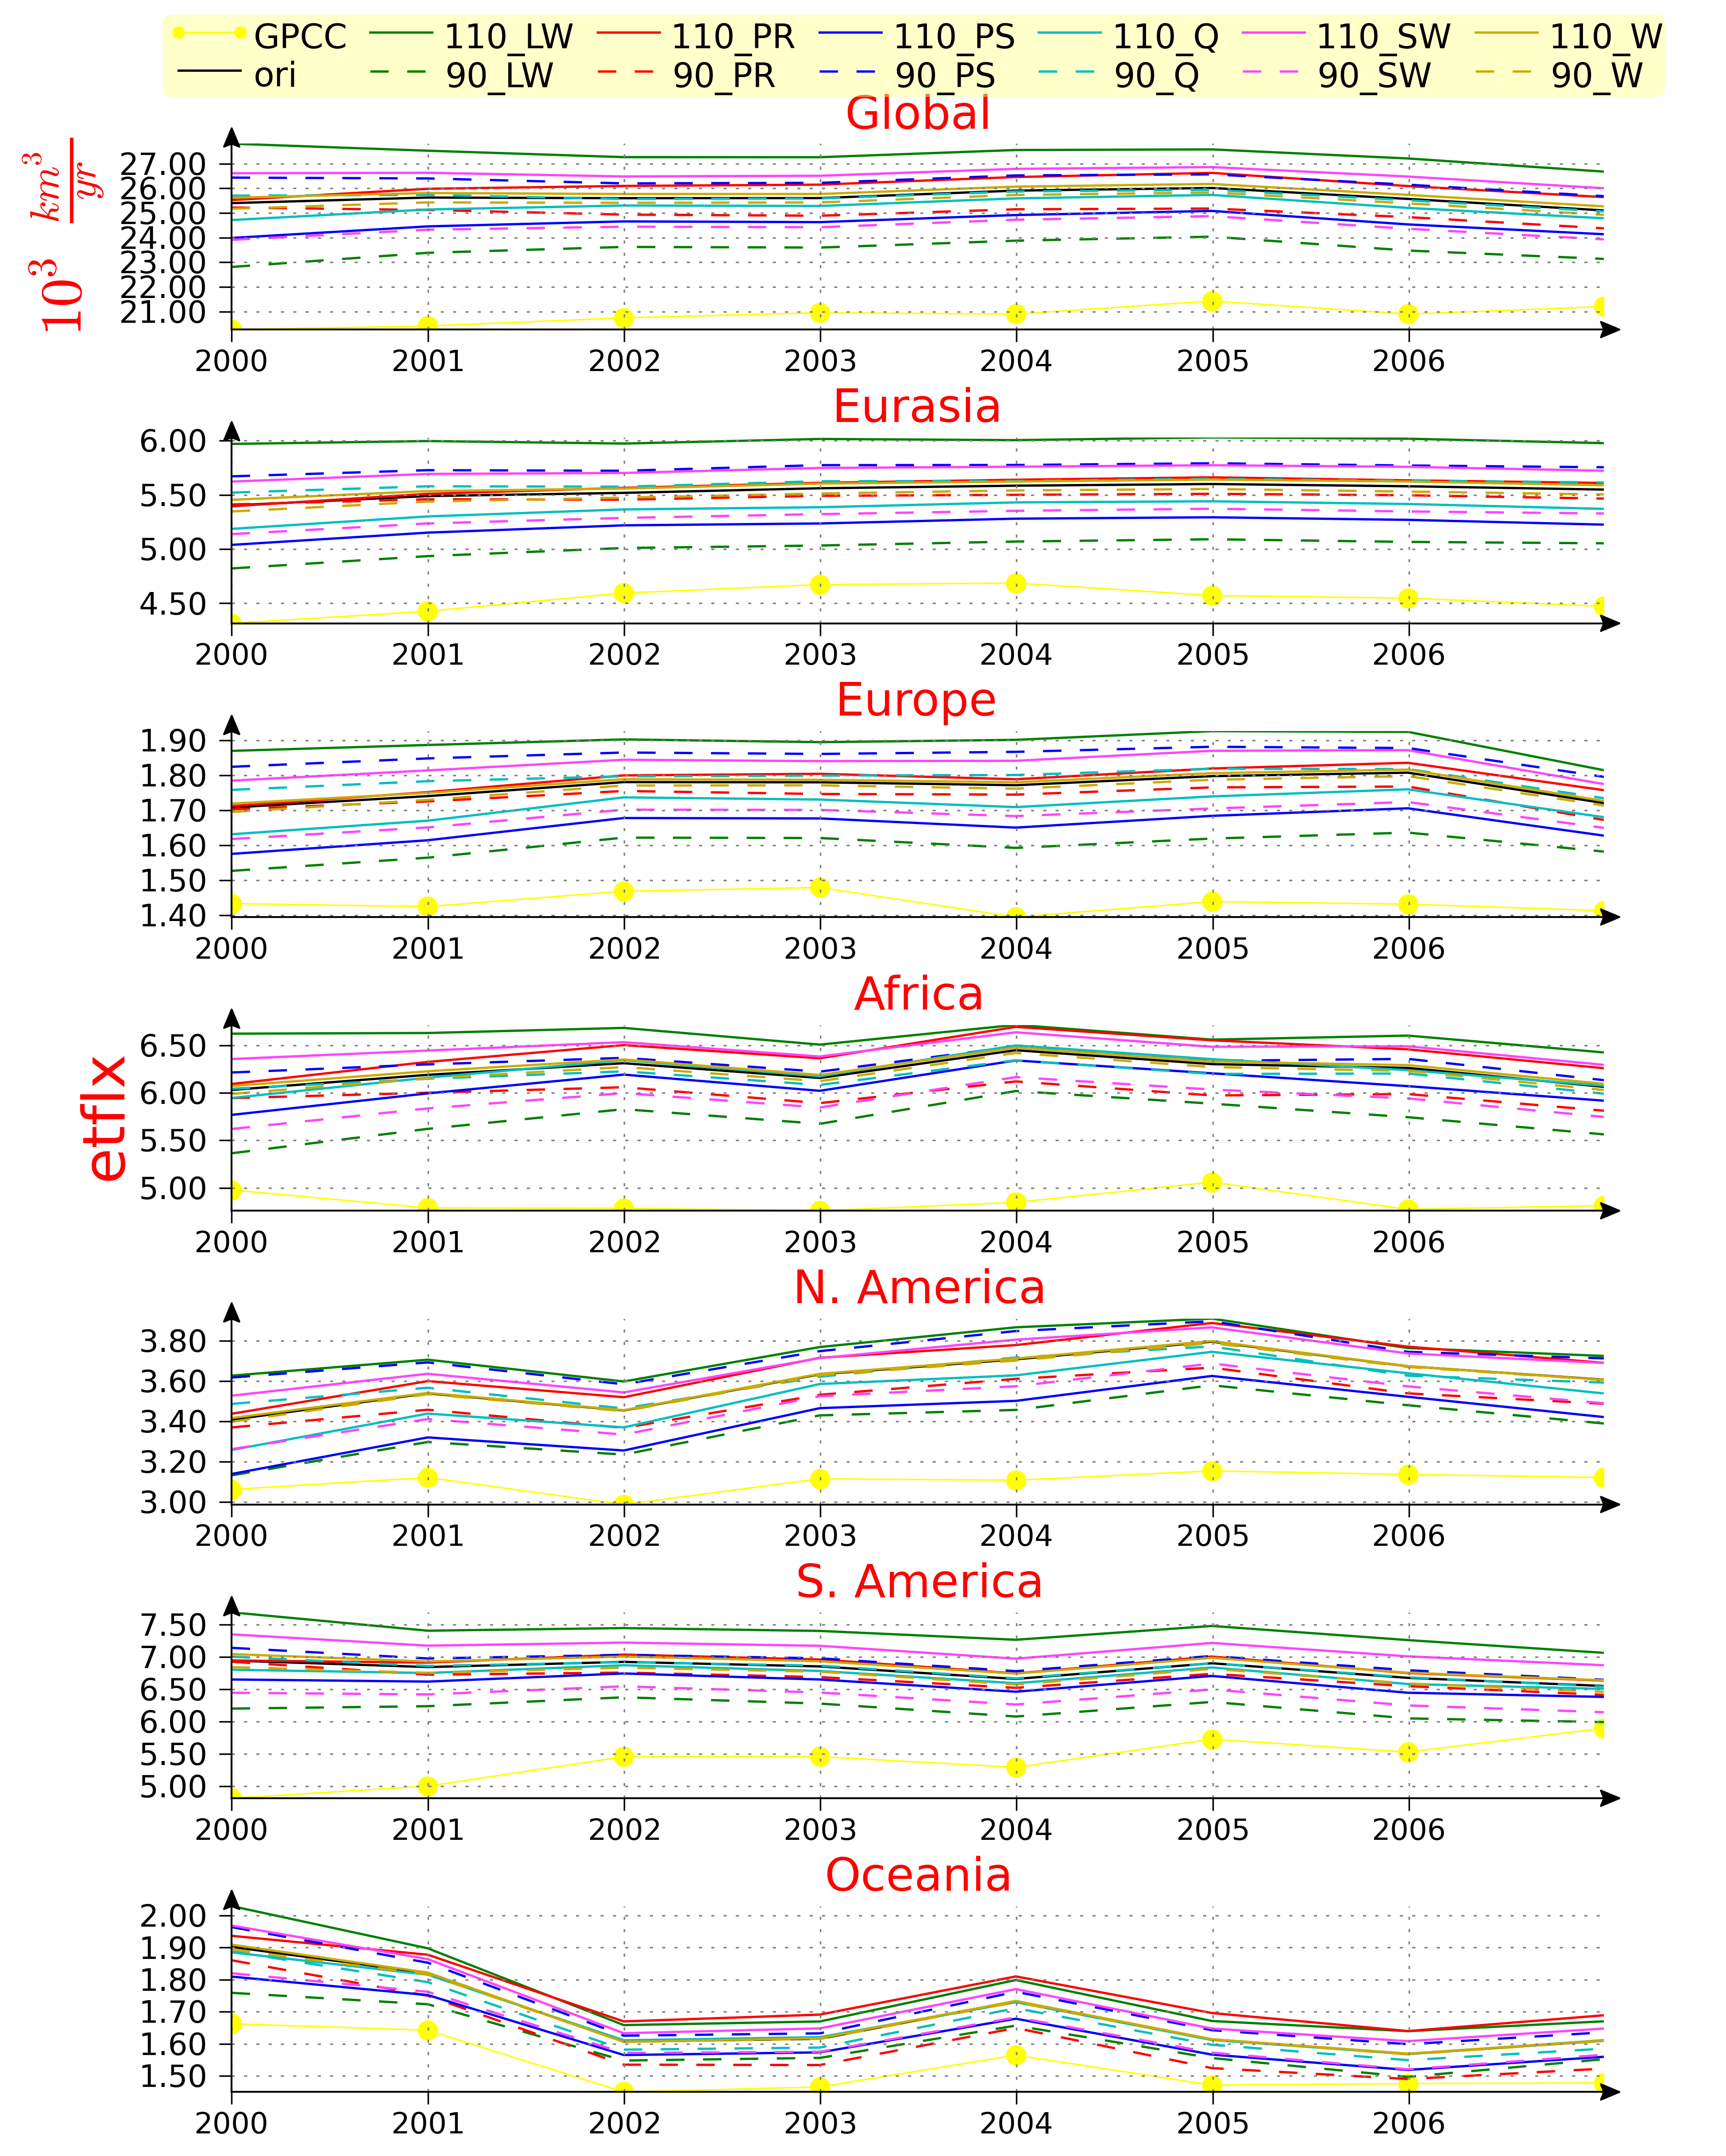
Sensitivity Analysis:
This section presents the comparison of simulations for analyzing the sensitivity of simulations to changes in forcing variables. Two simulations (10% increase and decrease) were carried out for each variable except for air temperature.
Legend:
- GPCC: simulation using GPCC data
- Ori: Original GSWP3 forcing
- 110: Runs in which the forcing parameter has been increased by 10 %.
- 90: Runs in which the forcing parameter has been decreased by 10 %.
- LW: Downward longwave radiation
- PR: Precipitation
- PS: Surface pressure
- Q: Specific humidity
- SW: Downward shortwave radiation
- W: Wind velocity
Global and Regional Means:
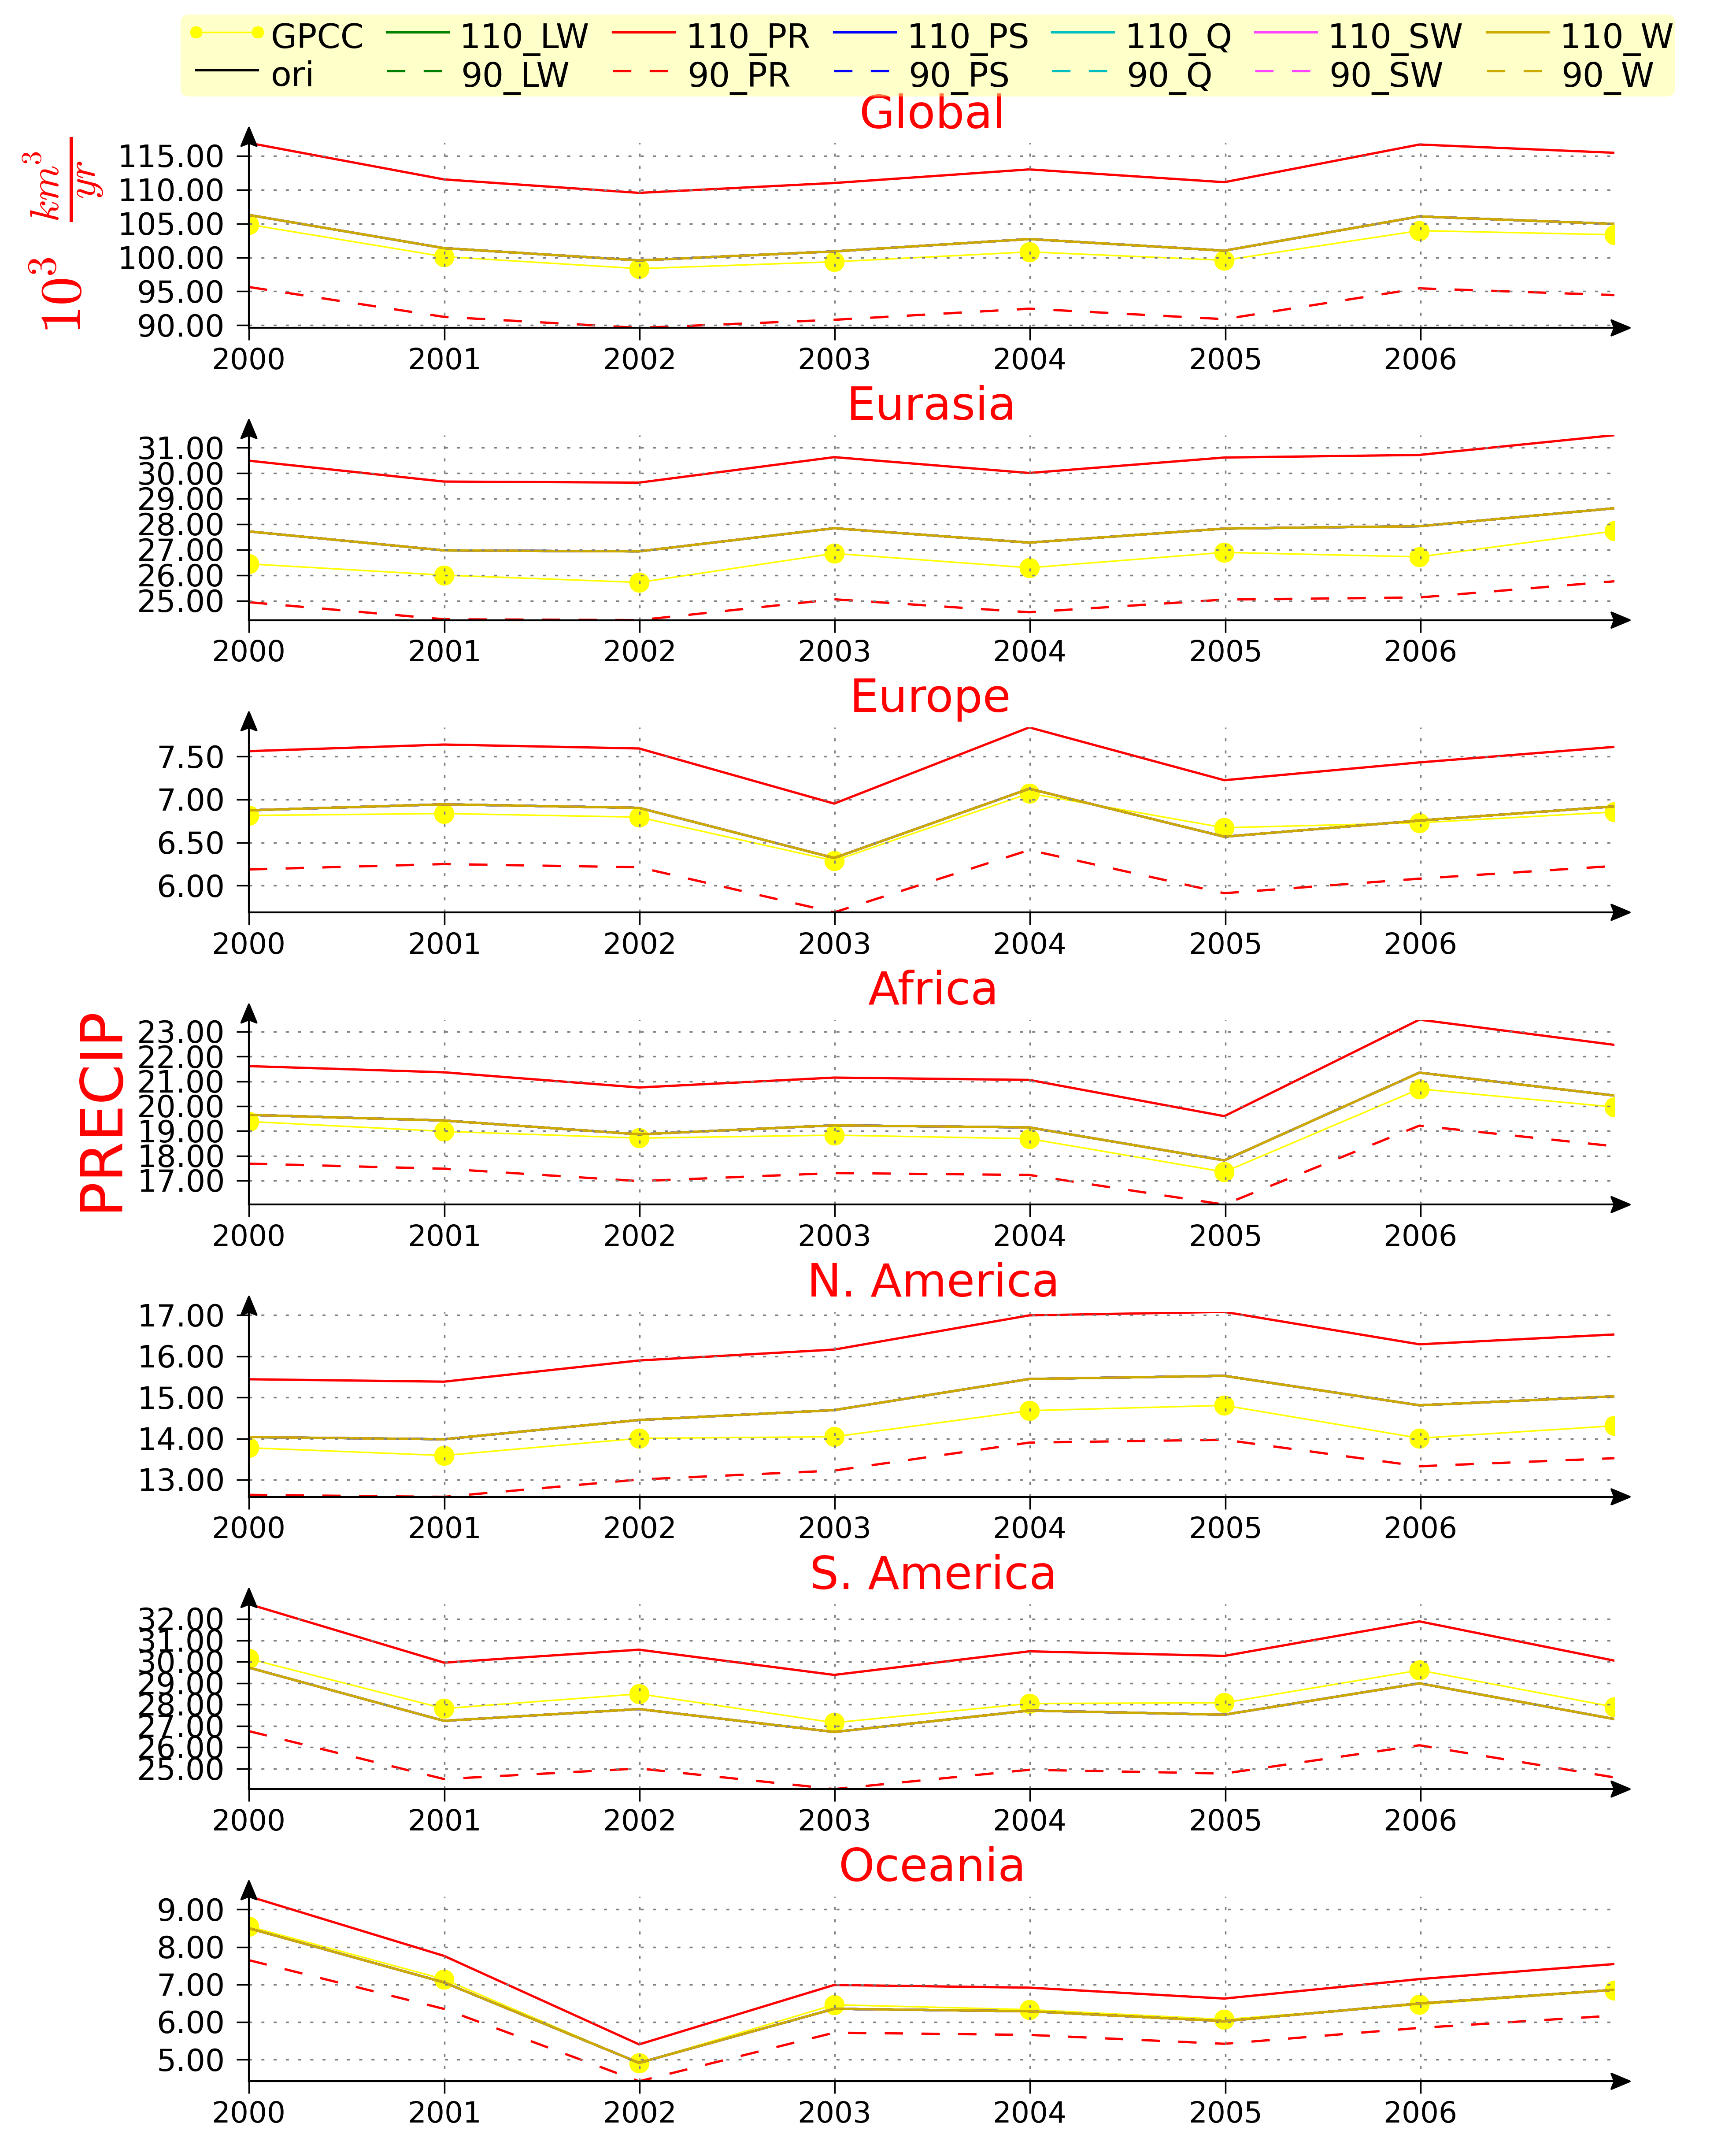 Precipitation (km3/yr) |
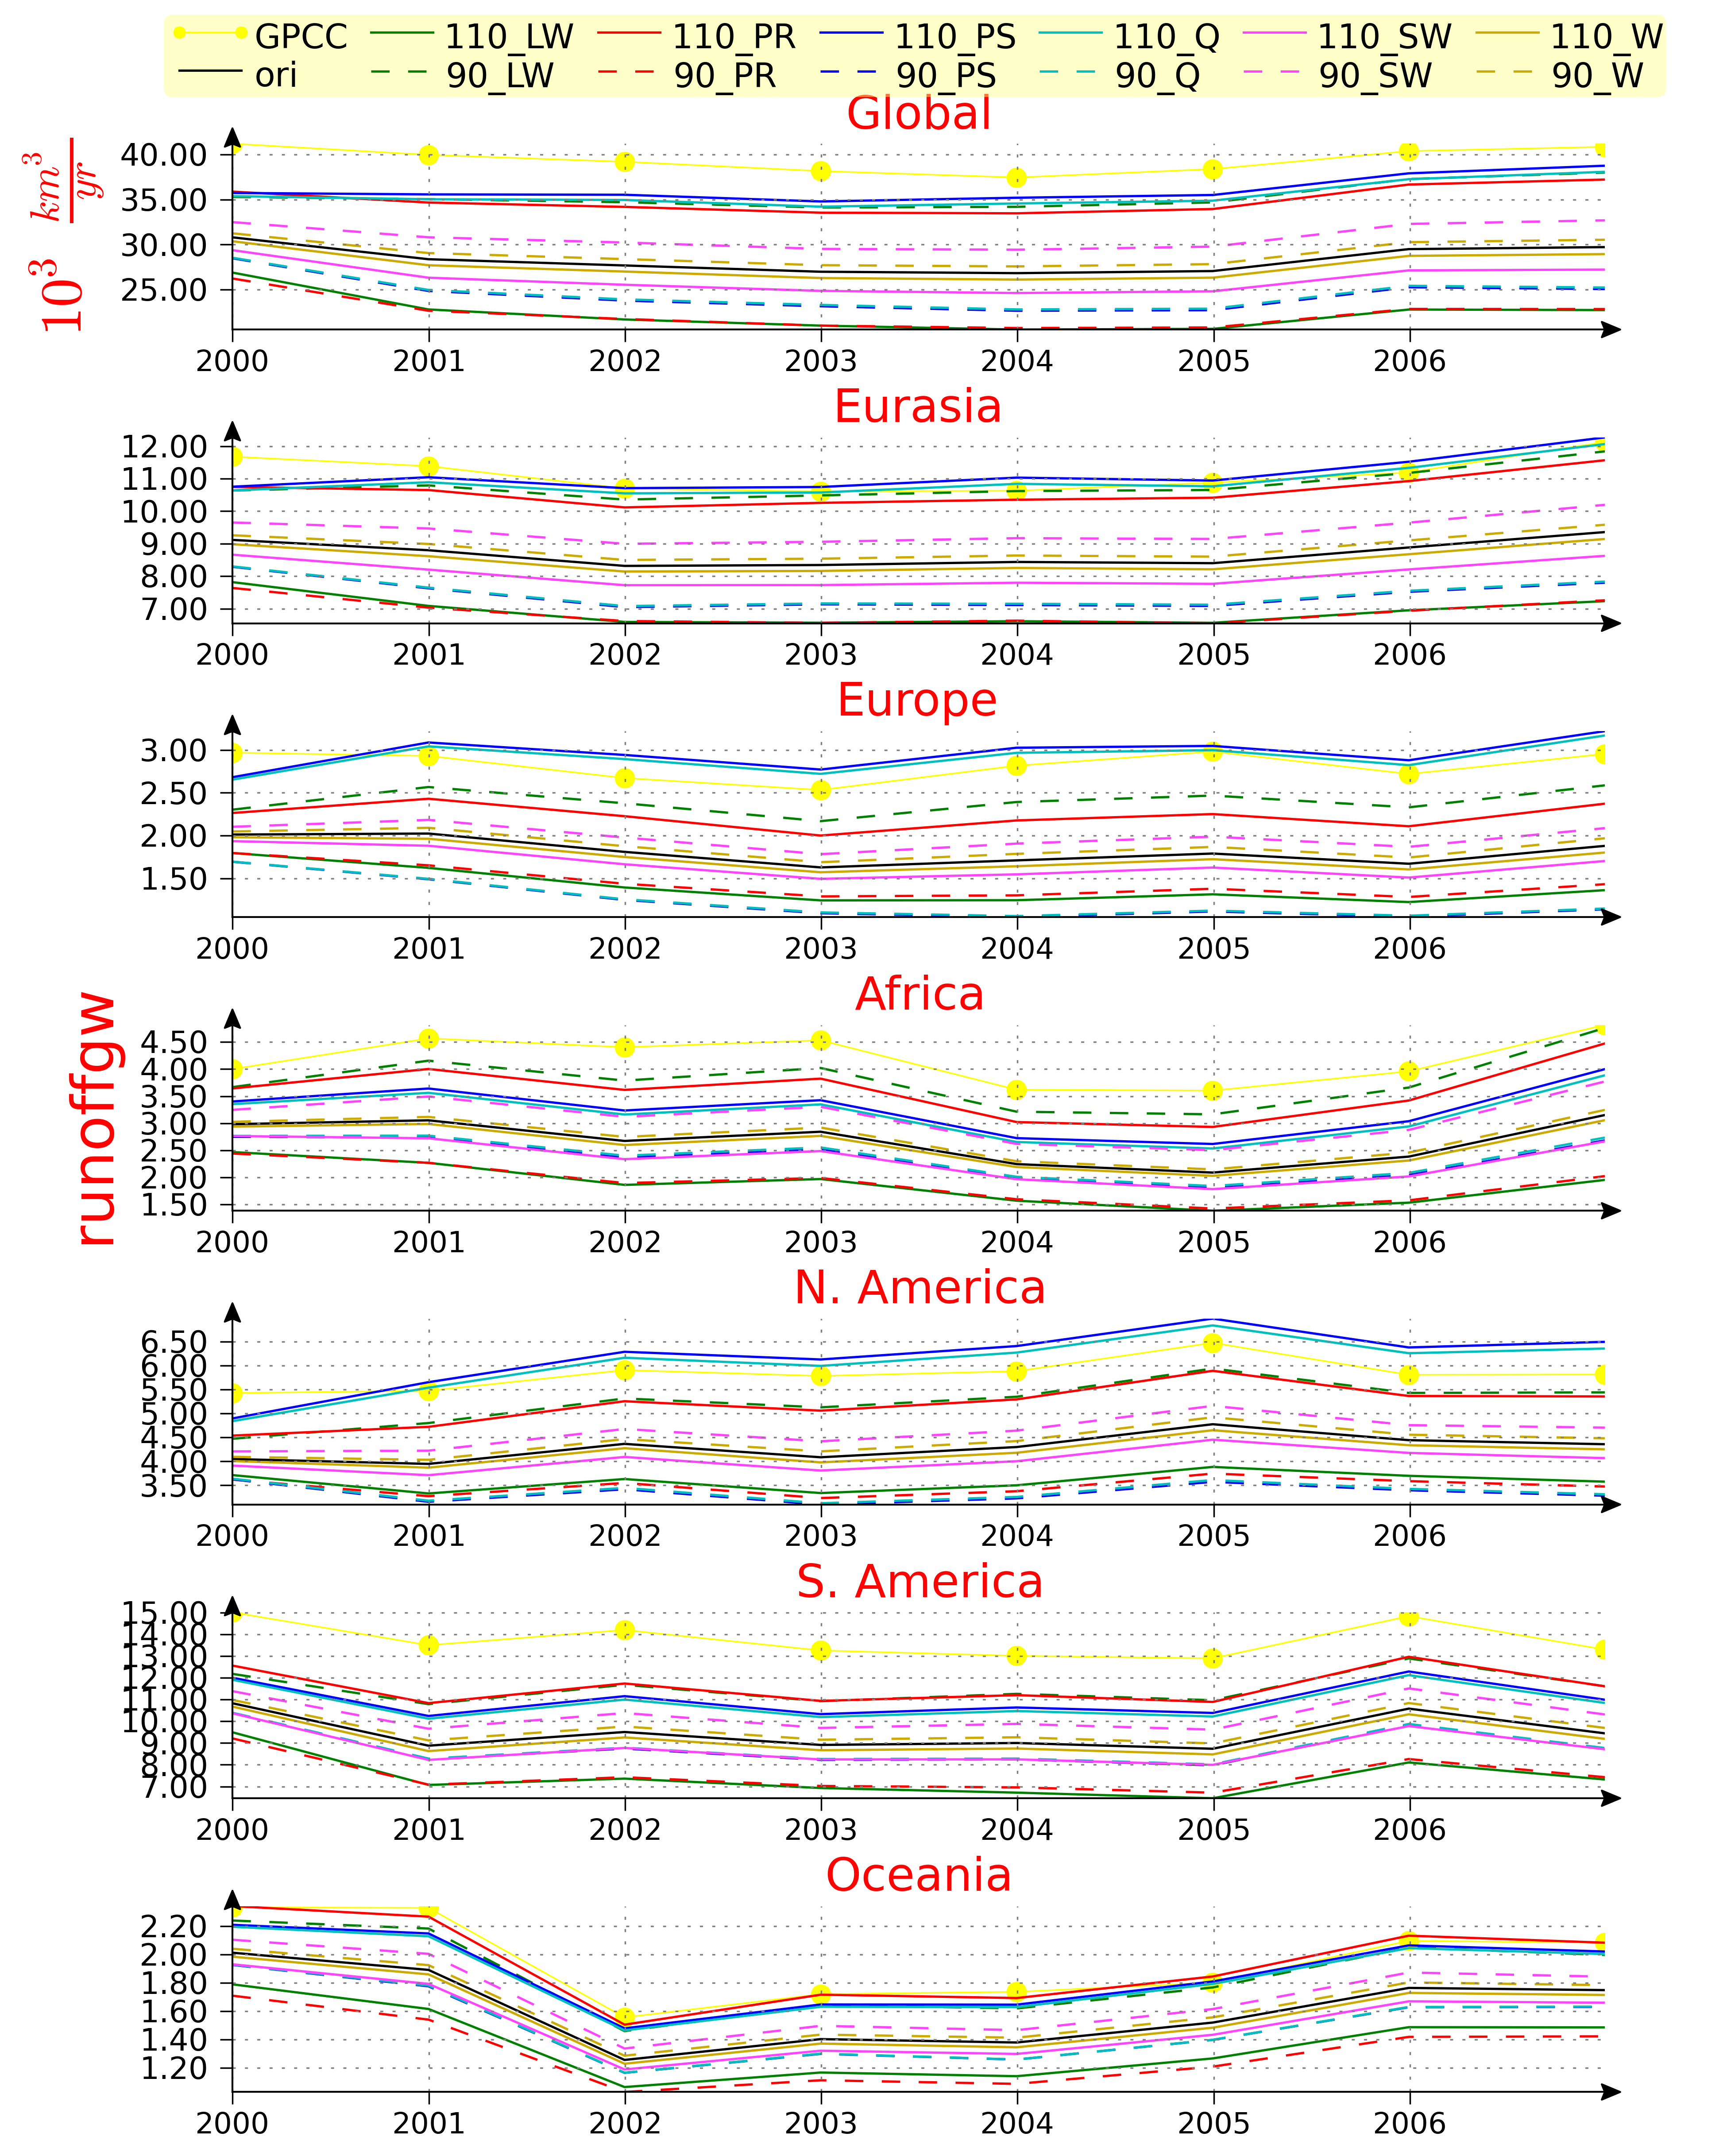 Total Runoff (km3/yr) |
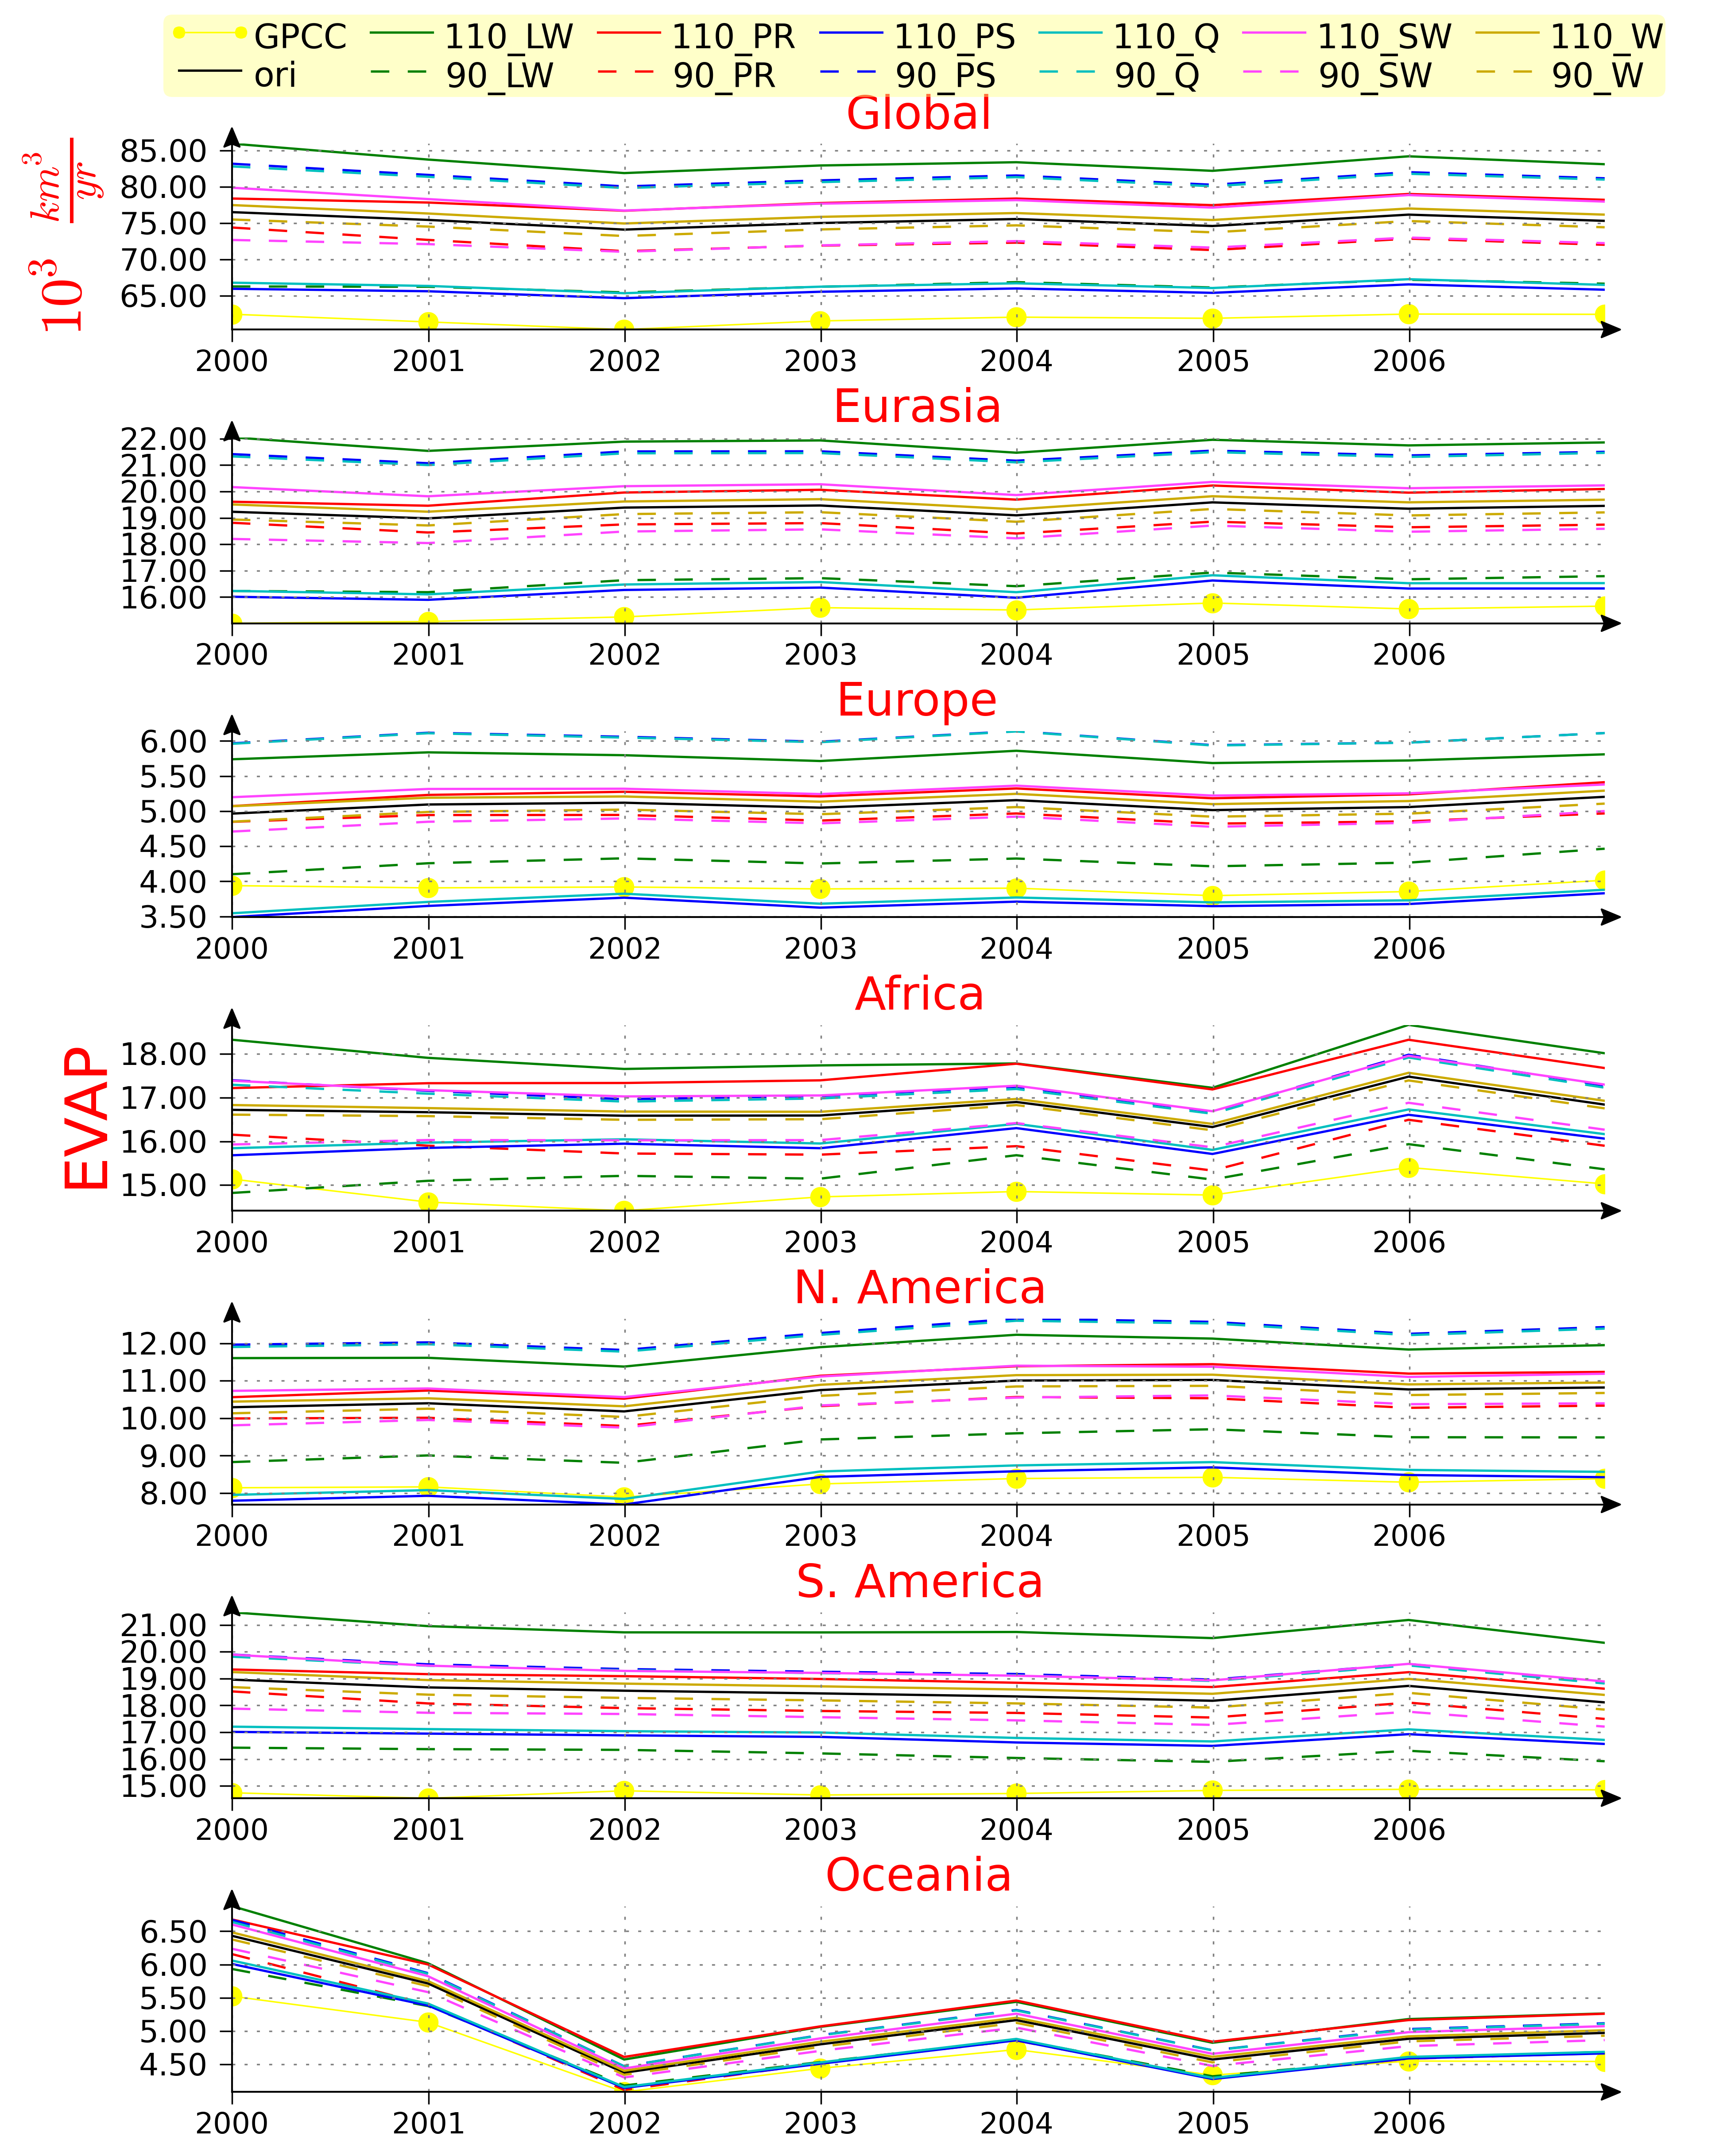 Evapotranspiration (km3/yr) |
 Soil Evaporation (km3/yr) |
 Transpiration (km3/yr) |
 Interception loss (km3/yr) |
Basin Scale Comparison:
Comparison of seasonal cycles of variables for different sensitvity runs. Discharge simulation using TRIP has also been compared with GRDC observation.
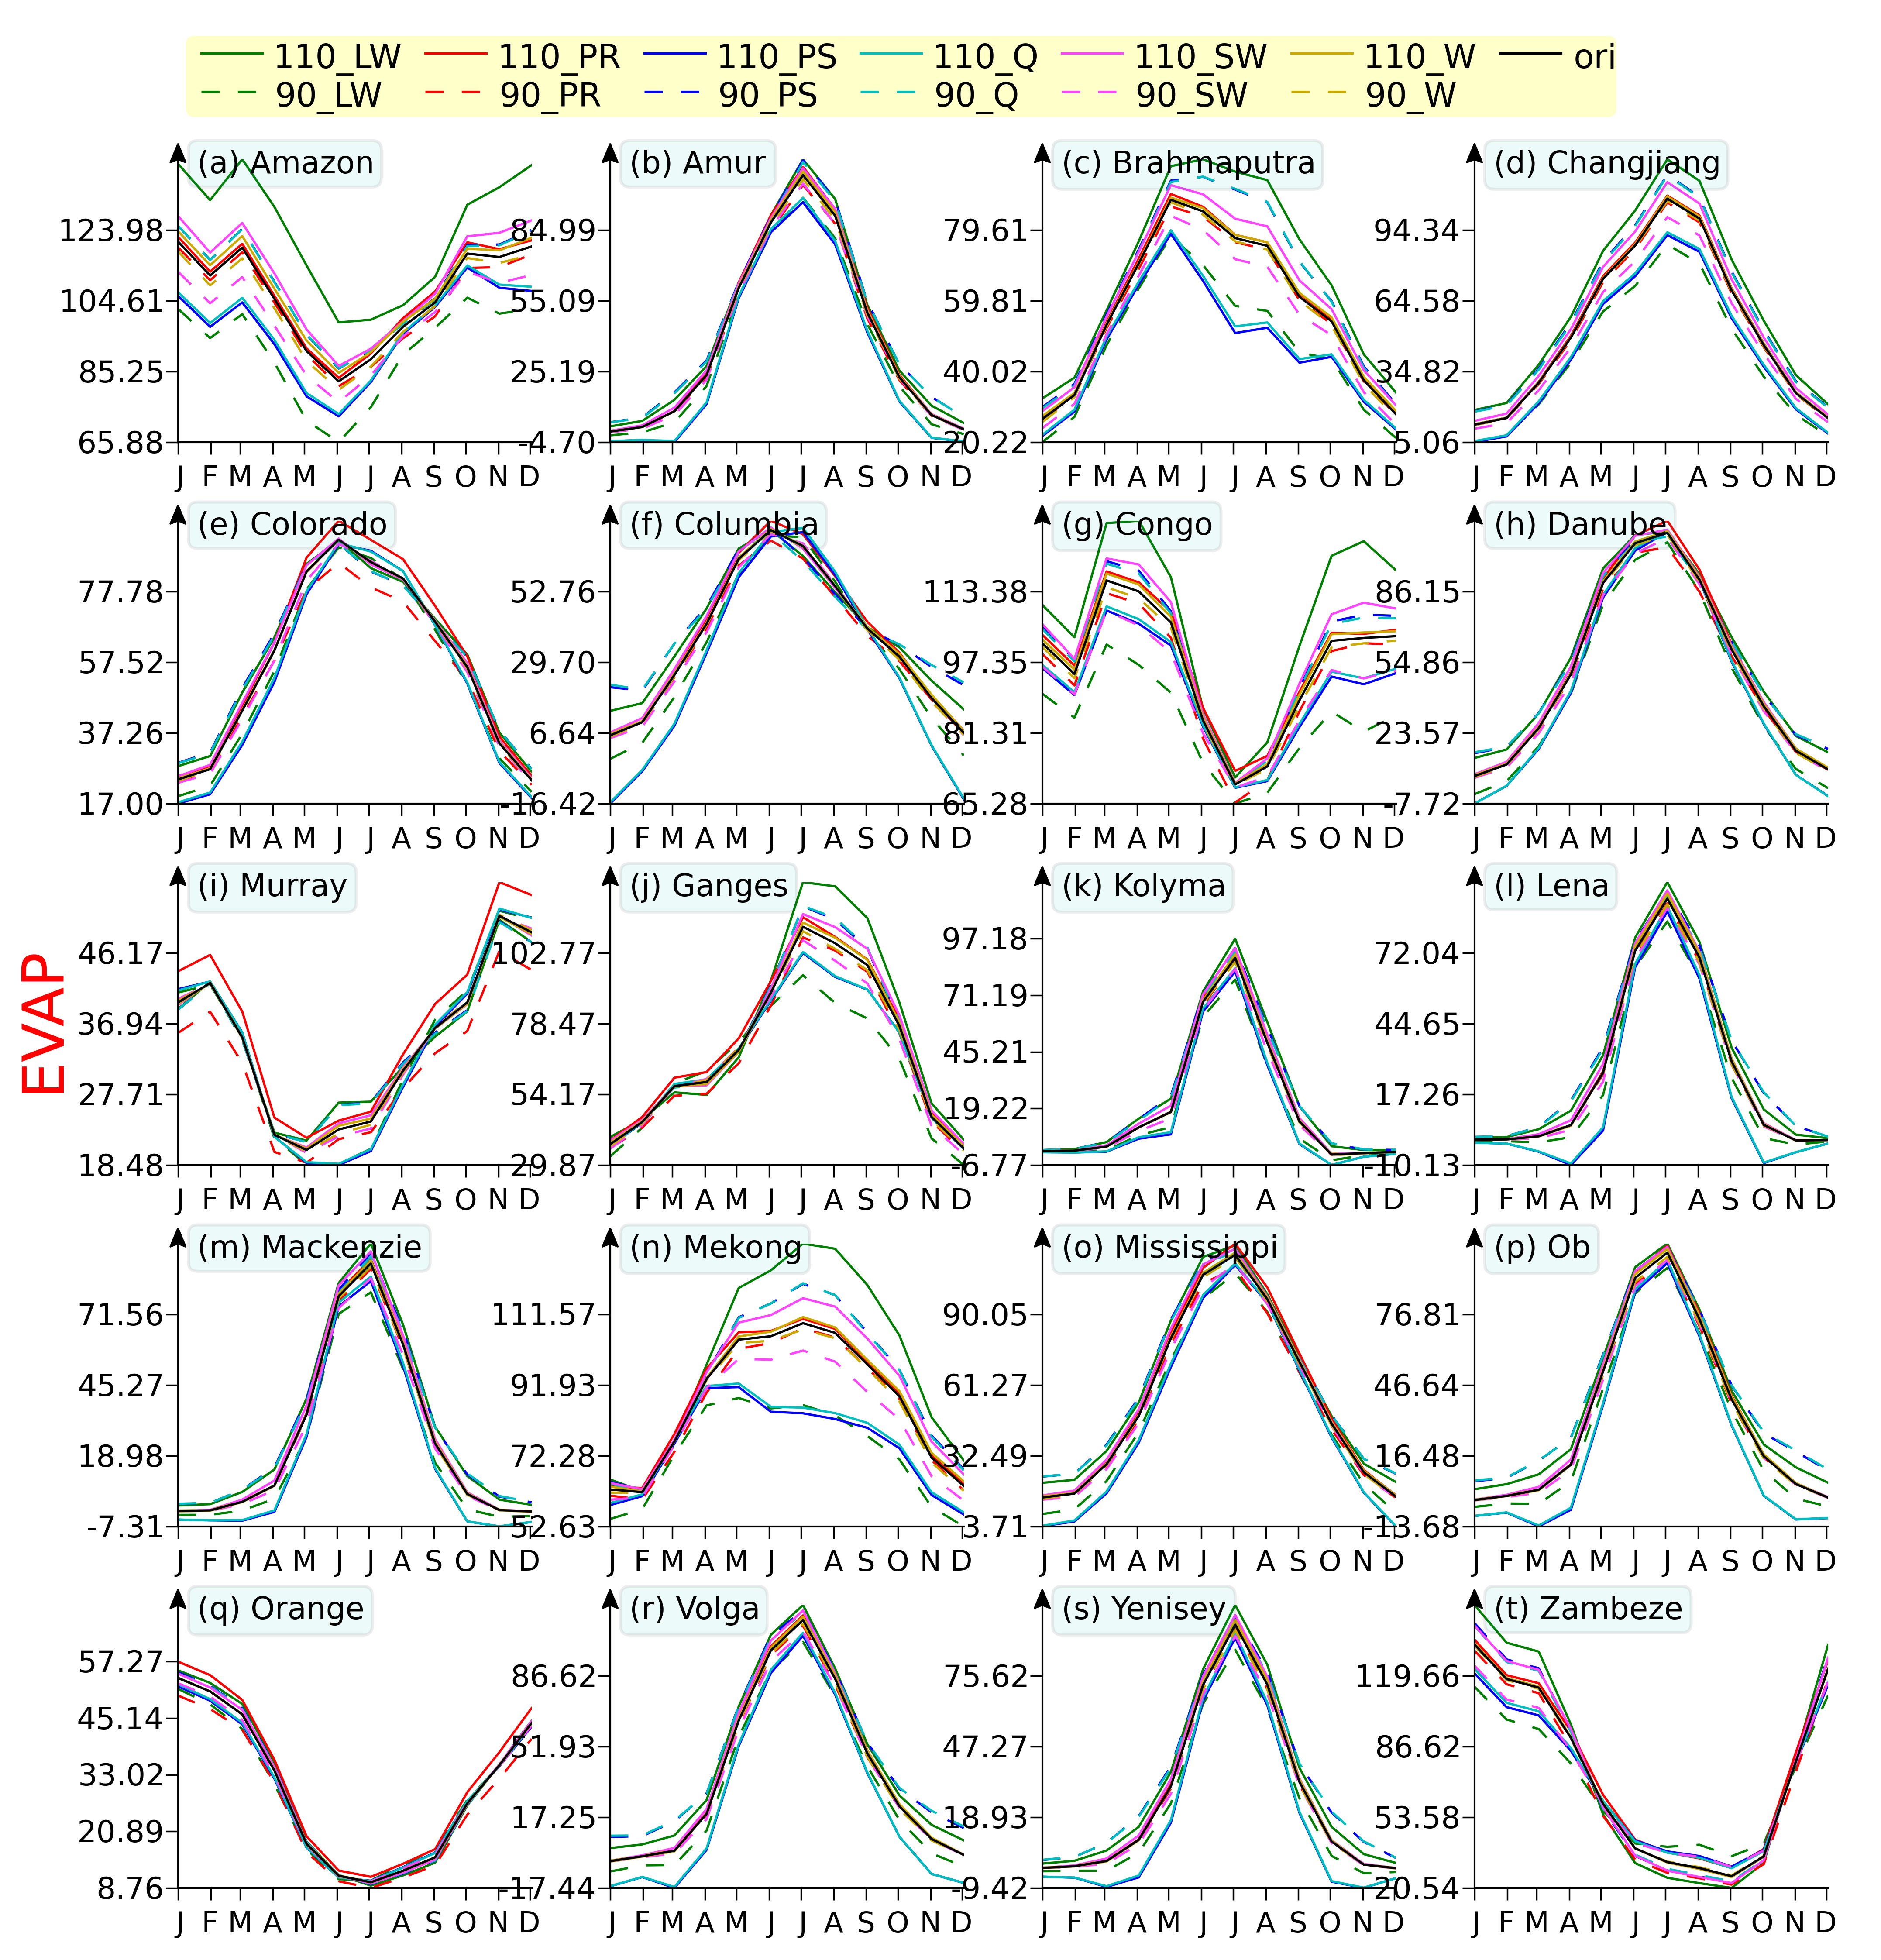 Evapotranspiration (mm/mon) |
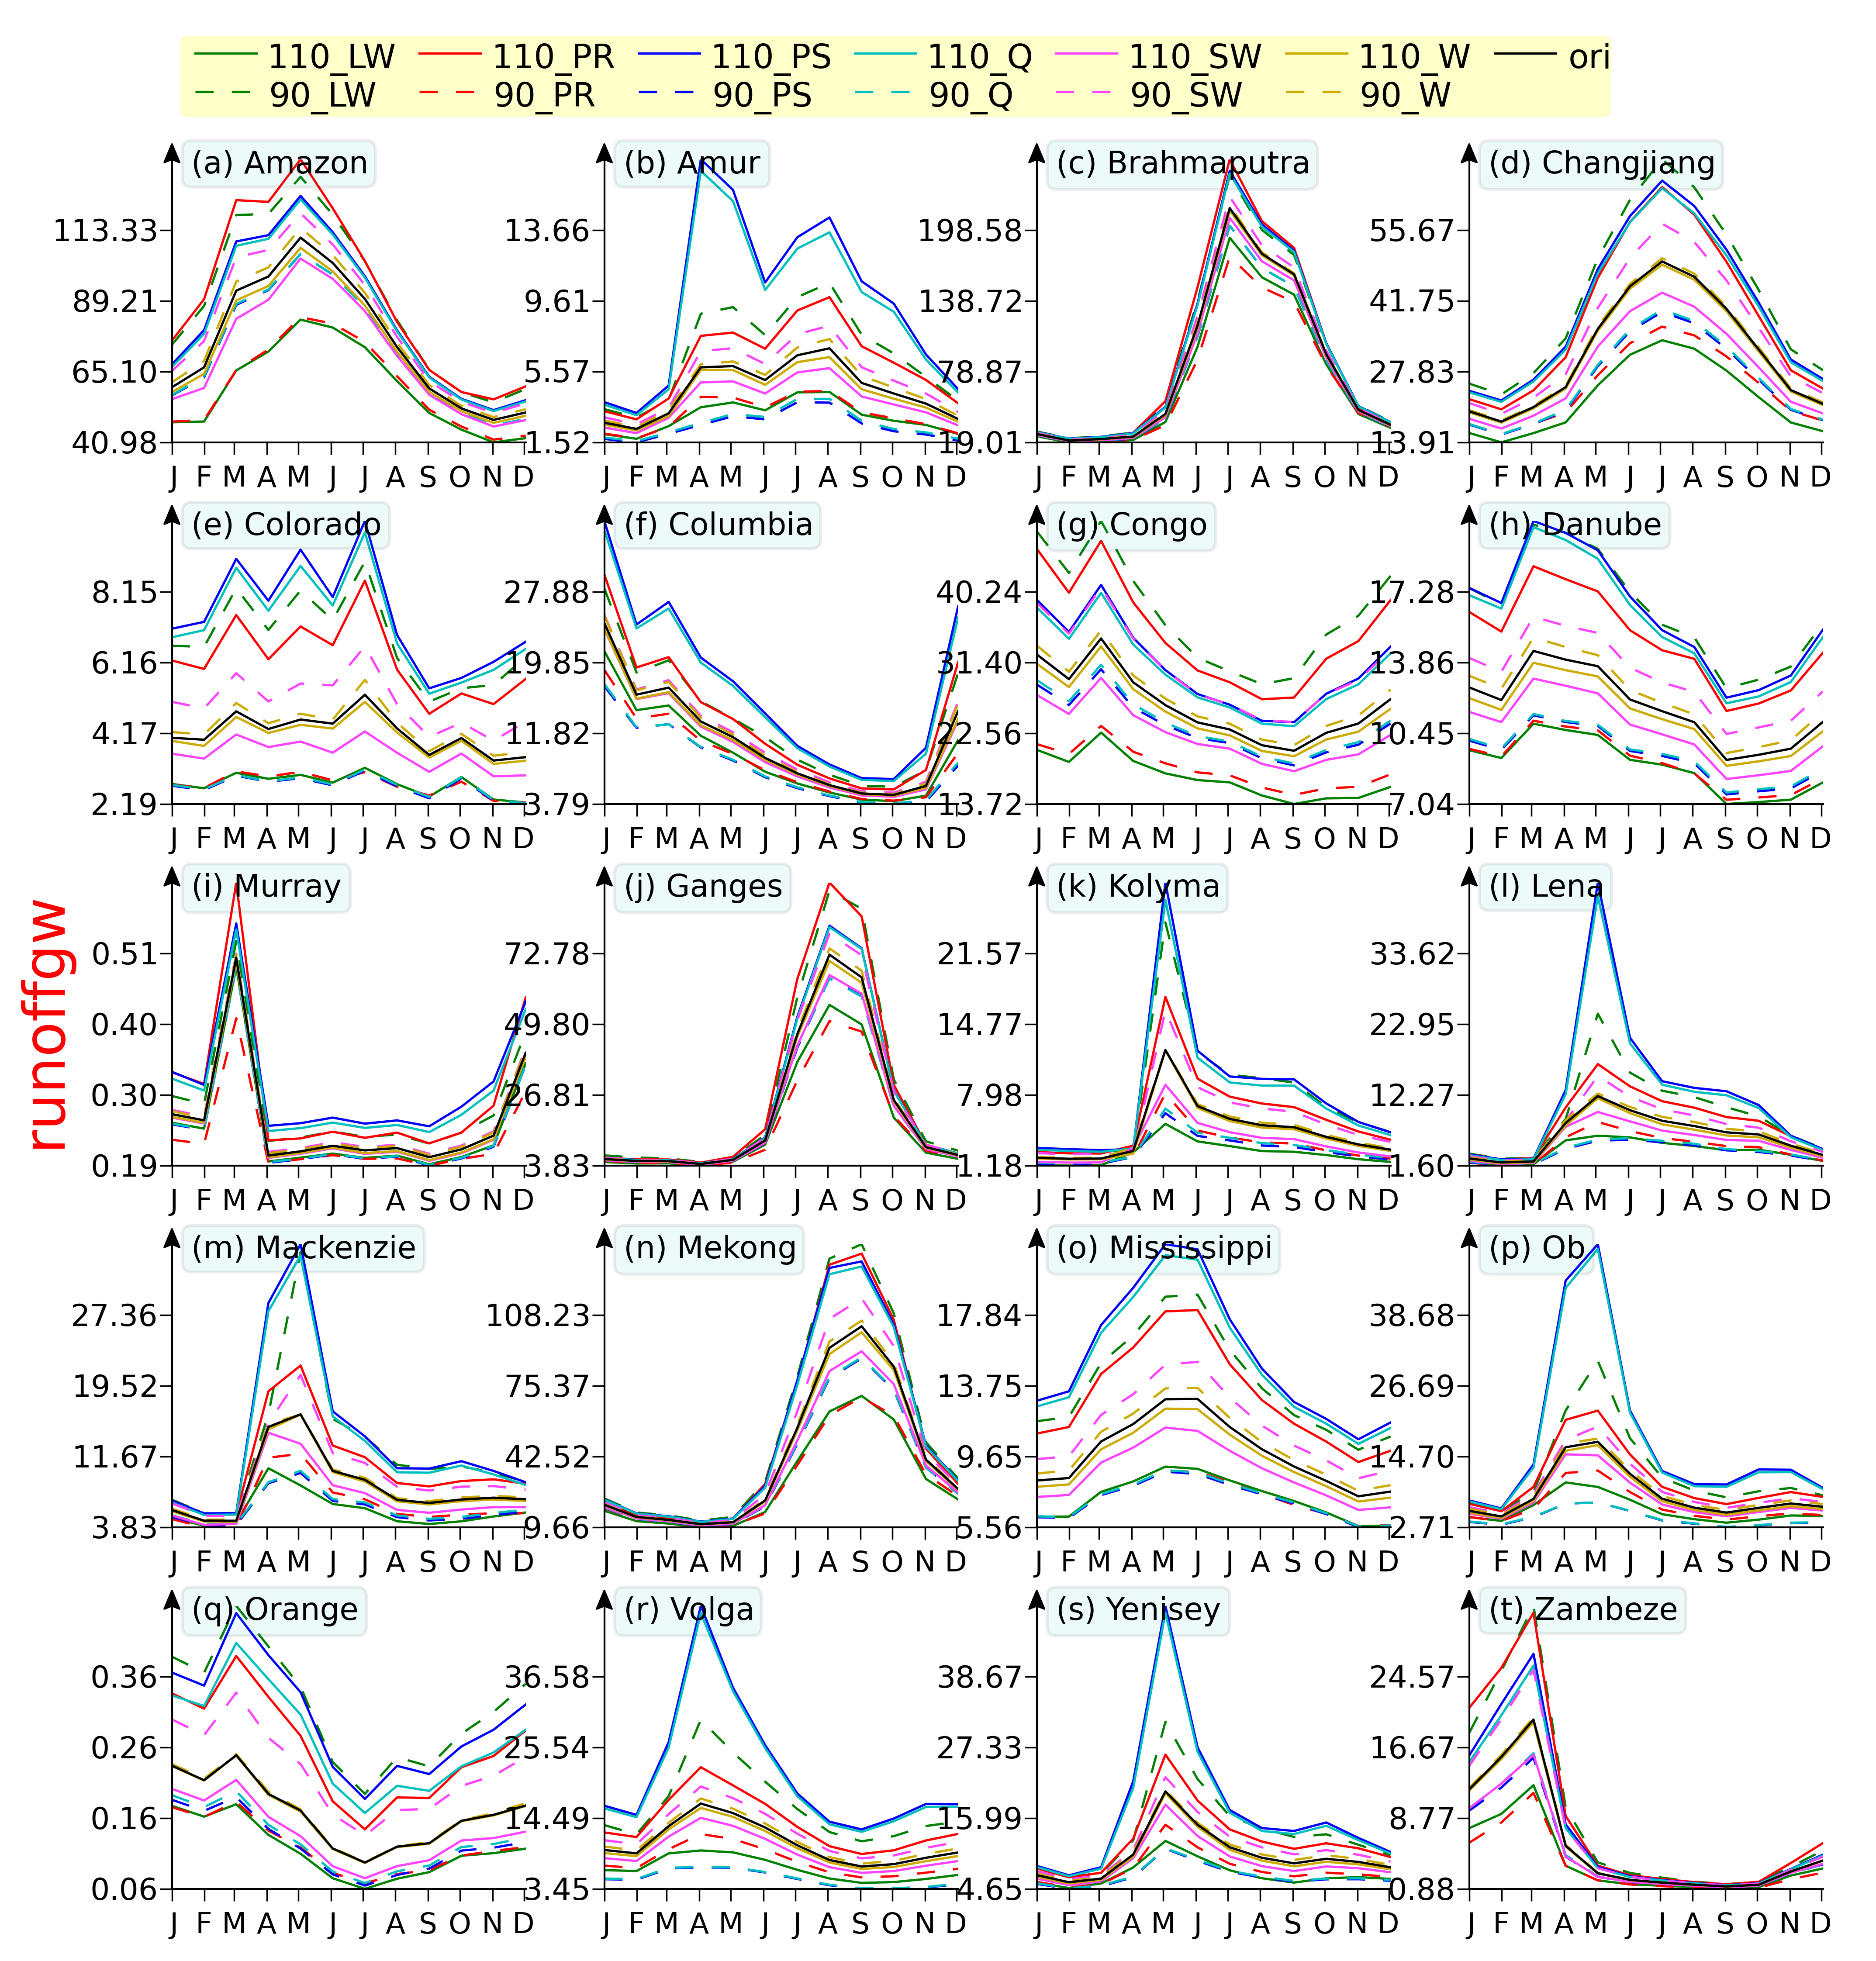 Total Runoff (mm/mon) |
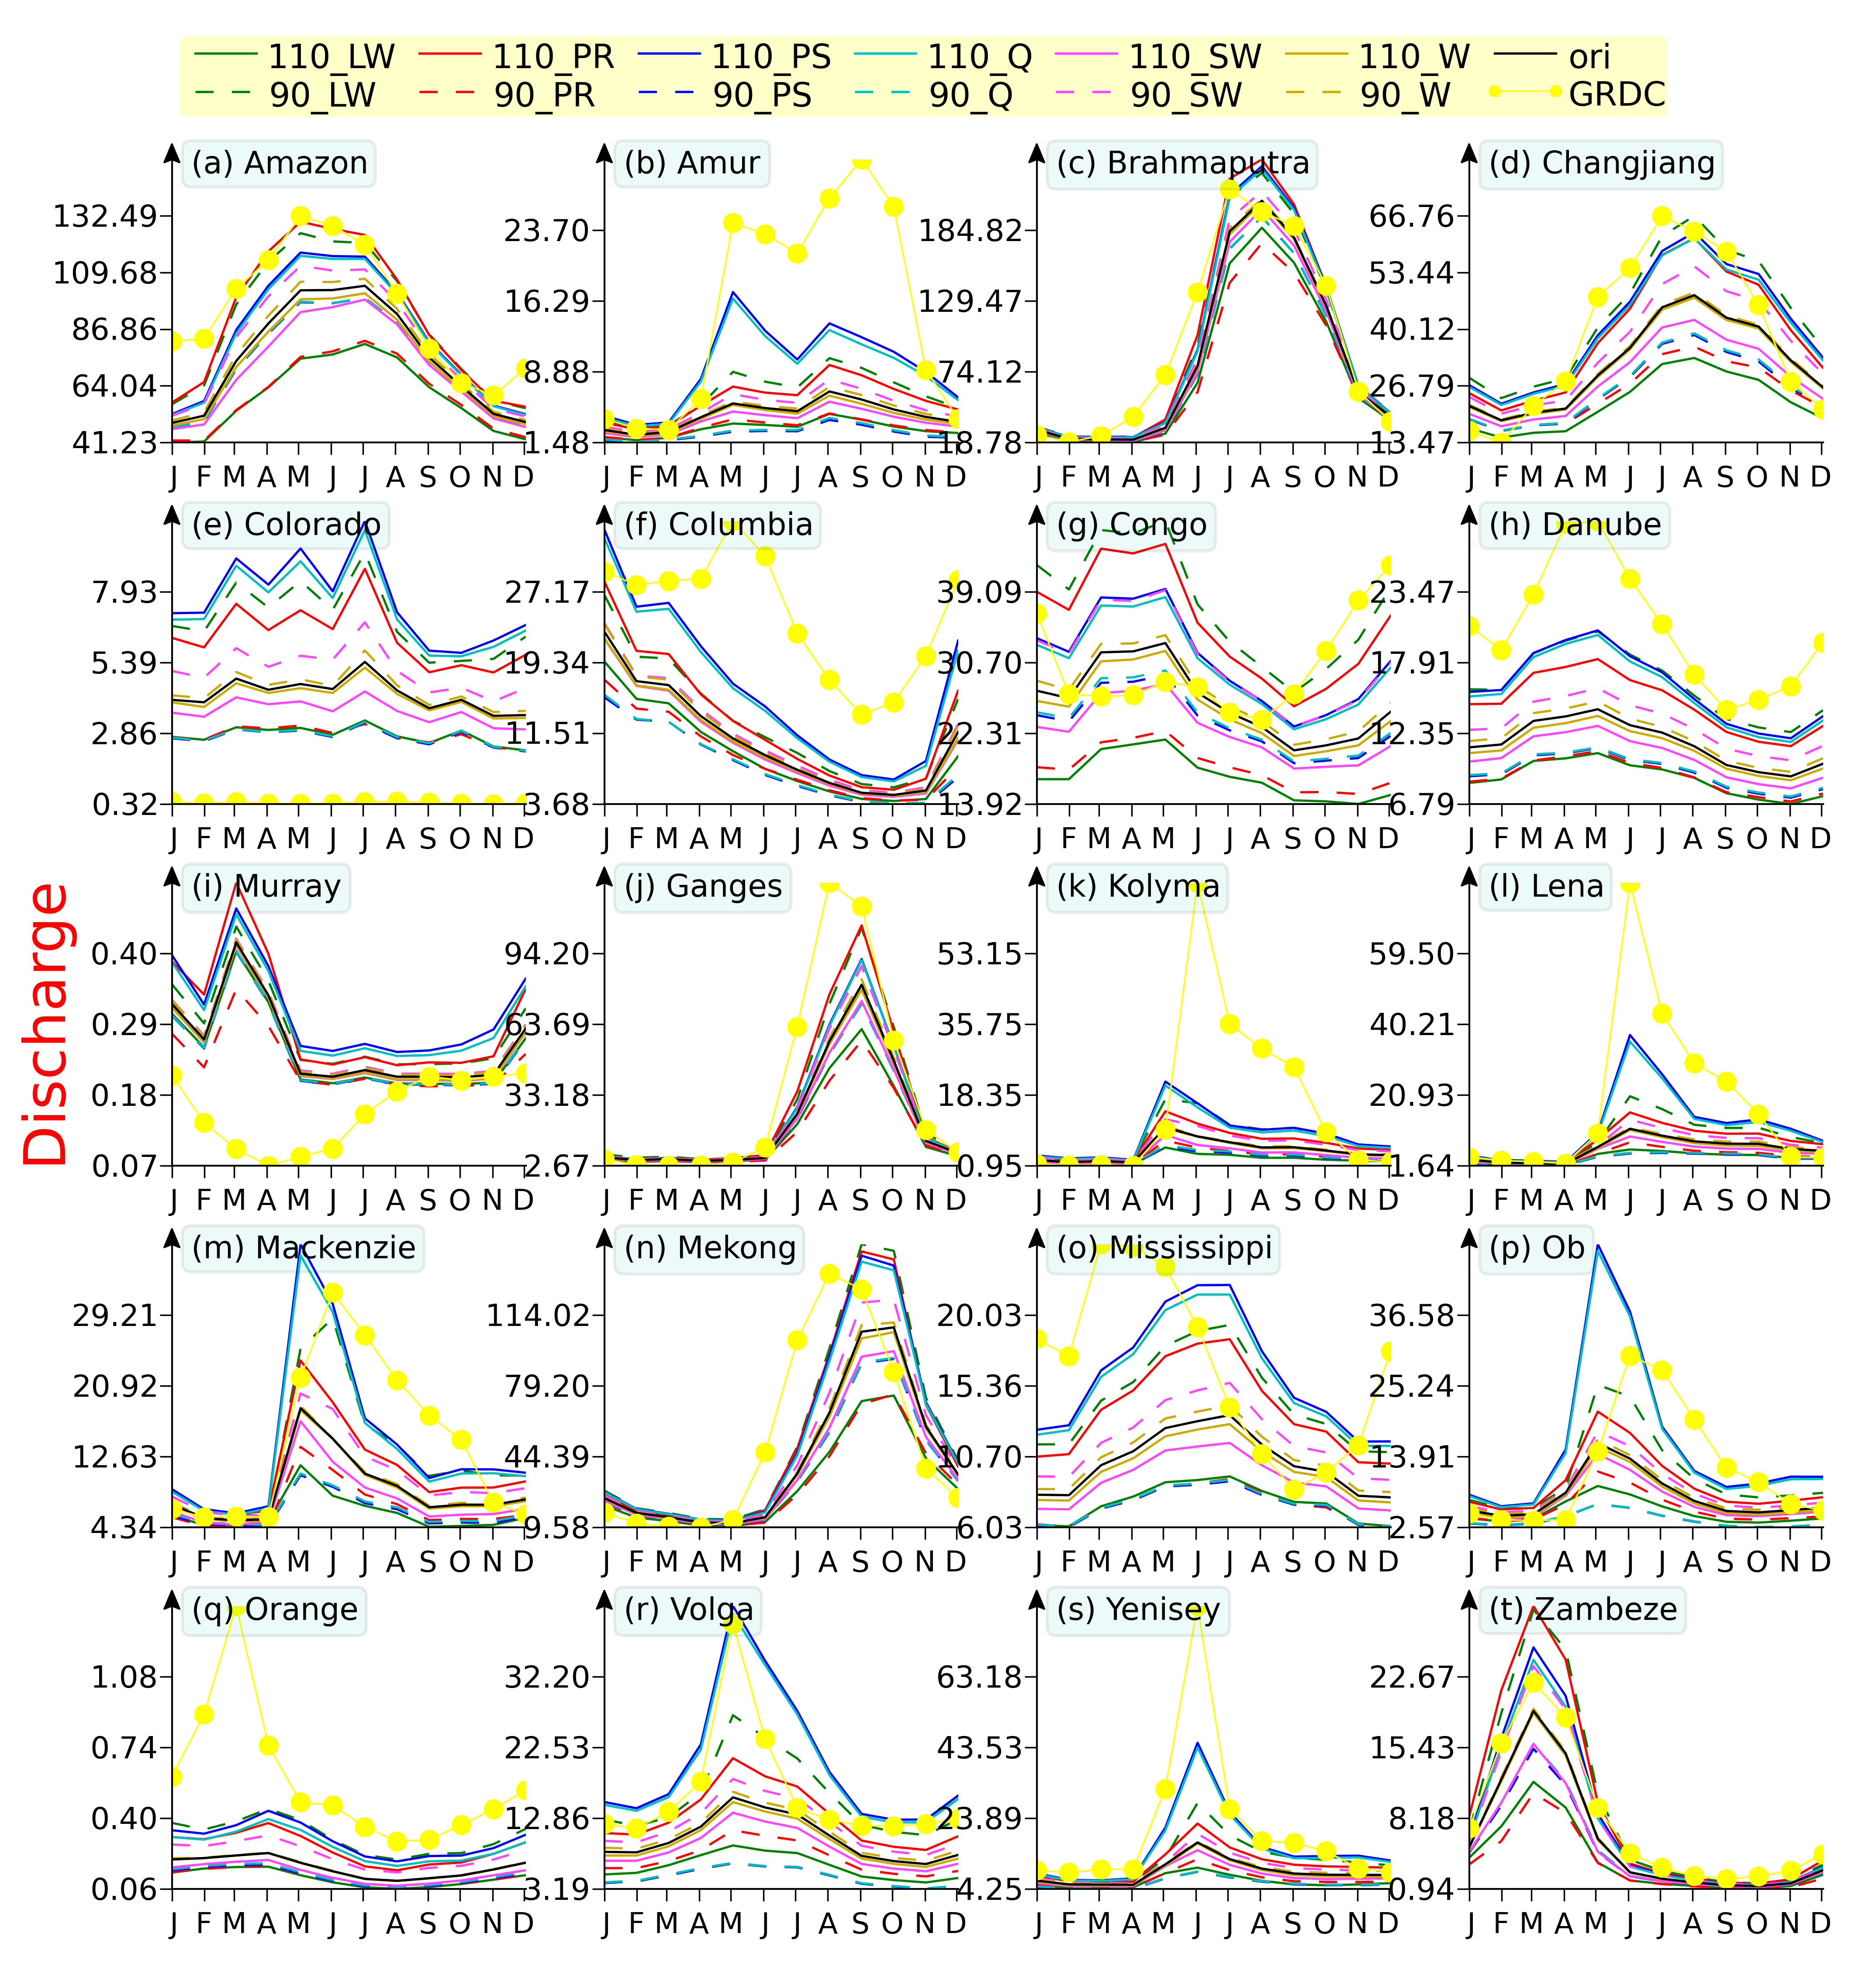 River Discharge (mm/mon) |