The soil map based on Harmonized World Soil Database v 1.1 has been prepared for use in GSWP3. The original HWSD data in 30 arc second spatial resolution was obtained from here. The original data consists of an image data in BIL (Band Interleaved by Line) format. The .bil file is a raster binary file with 16 bit integer values. HWSD also provides attribute table relating the grid values (in .bil file) with various soil attributes including content (%) of sand, clay, and silt.
Two methods were used to obtain soil texture map in half and one degree resolutions.
Method A:
Calculate the amount of sand, clay, and silt contents in each half/one degree grid from 30 second contents map and then use USDA soil texture classification triangle to find the soil texture.
- Global maps of sand, clay, and silt content was prepared in 30 arc second resolution using .bil file and attribute table.
- The contents in 30 arc second resolution were then converted to half and one degree resolutions by calculating the amount of sand, clay and silt in each grid (averaging the contents of all 30 arc second grid cells lying within a half/one degree cell).
- The soil texture classification were obtained from sand, clay, and silt contents using the USDA soil texture classification triangle like this.
- In the final step, grid cells with missing data in HWSD data were assigned loam (4) type and grid cells in Greenland with no data were simply assigned as continental ice grids.
Method B:
Use the USDA soil texture triangle (using the amount of sand, clay, and silt contents) to identify the soil texture in 30 second resolution and then finding the major soil type in half/one degree resolution by counting number of 30 second grids with each type of soil and adopting the major one.
- Global maps of sand, clay, and silt content was prepared in 30 arc second resolution using .bil file and attribute table.
- The soil texture classification in 30 second resolution was obtained from sand, clay, and silt contents using the USDA soil texture classification triangle like this.
- Count the number of 30 second grids lying within a half/one degree grid with each type of soil and adopt a soil type with maximum number of 30 second grids.
- In the final step, grid cells with missing data in HWSD data were assigned loam (4) type and grid cells in Greenland with no data were simply assigned as continental ice grids.
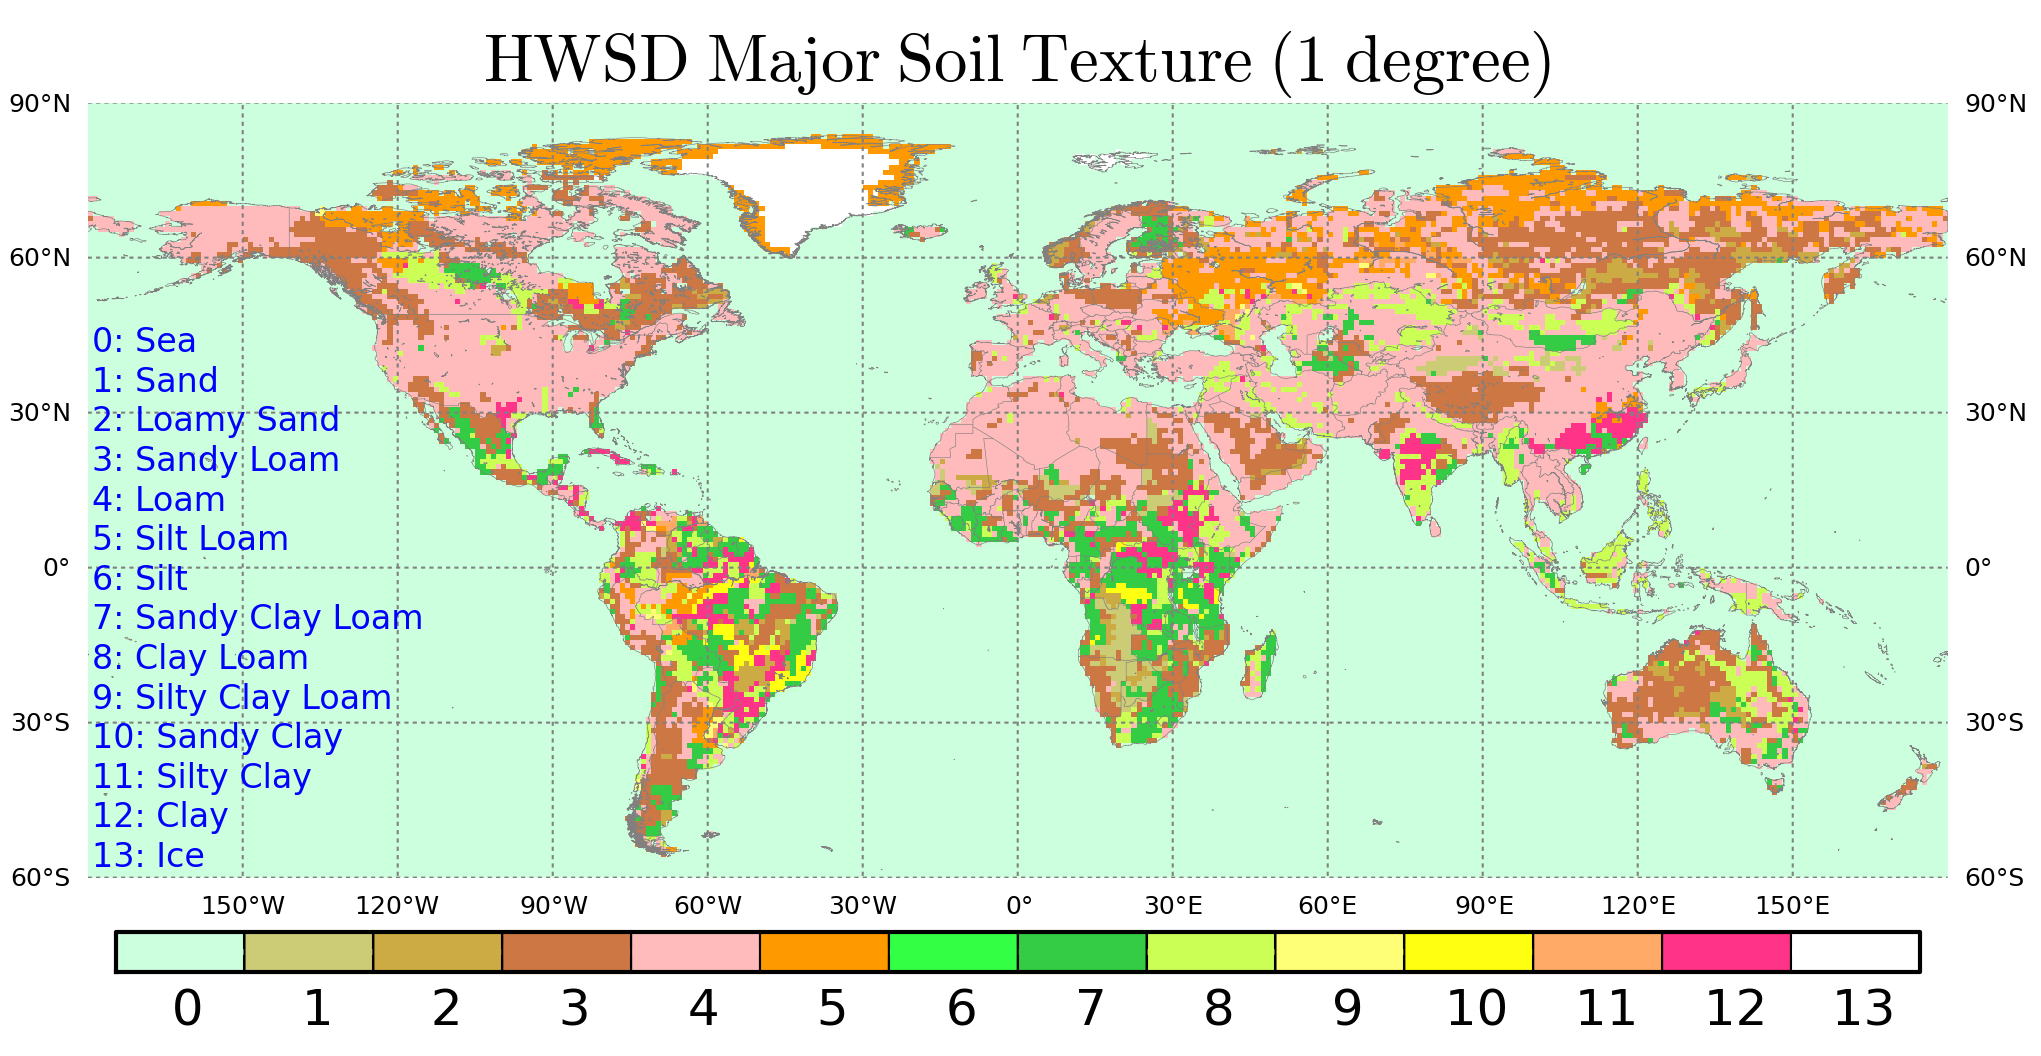
The global distribution of HWSD-based half and one degree soil maps are presented in Figure 1 and Figure 2 respectively. Soil texture classes smooth up to close texture classes when the resolution is decreased from half degree to one degree (e.g., in Russia, sandy loam grids in half degree are classified as loam in one degree versions due to aggregation of contents).
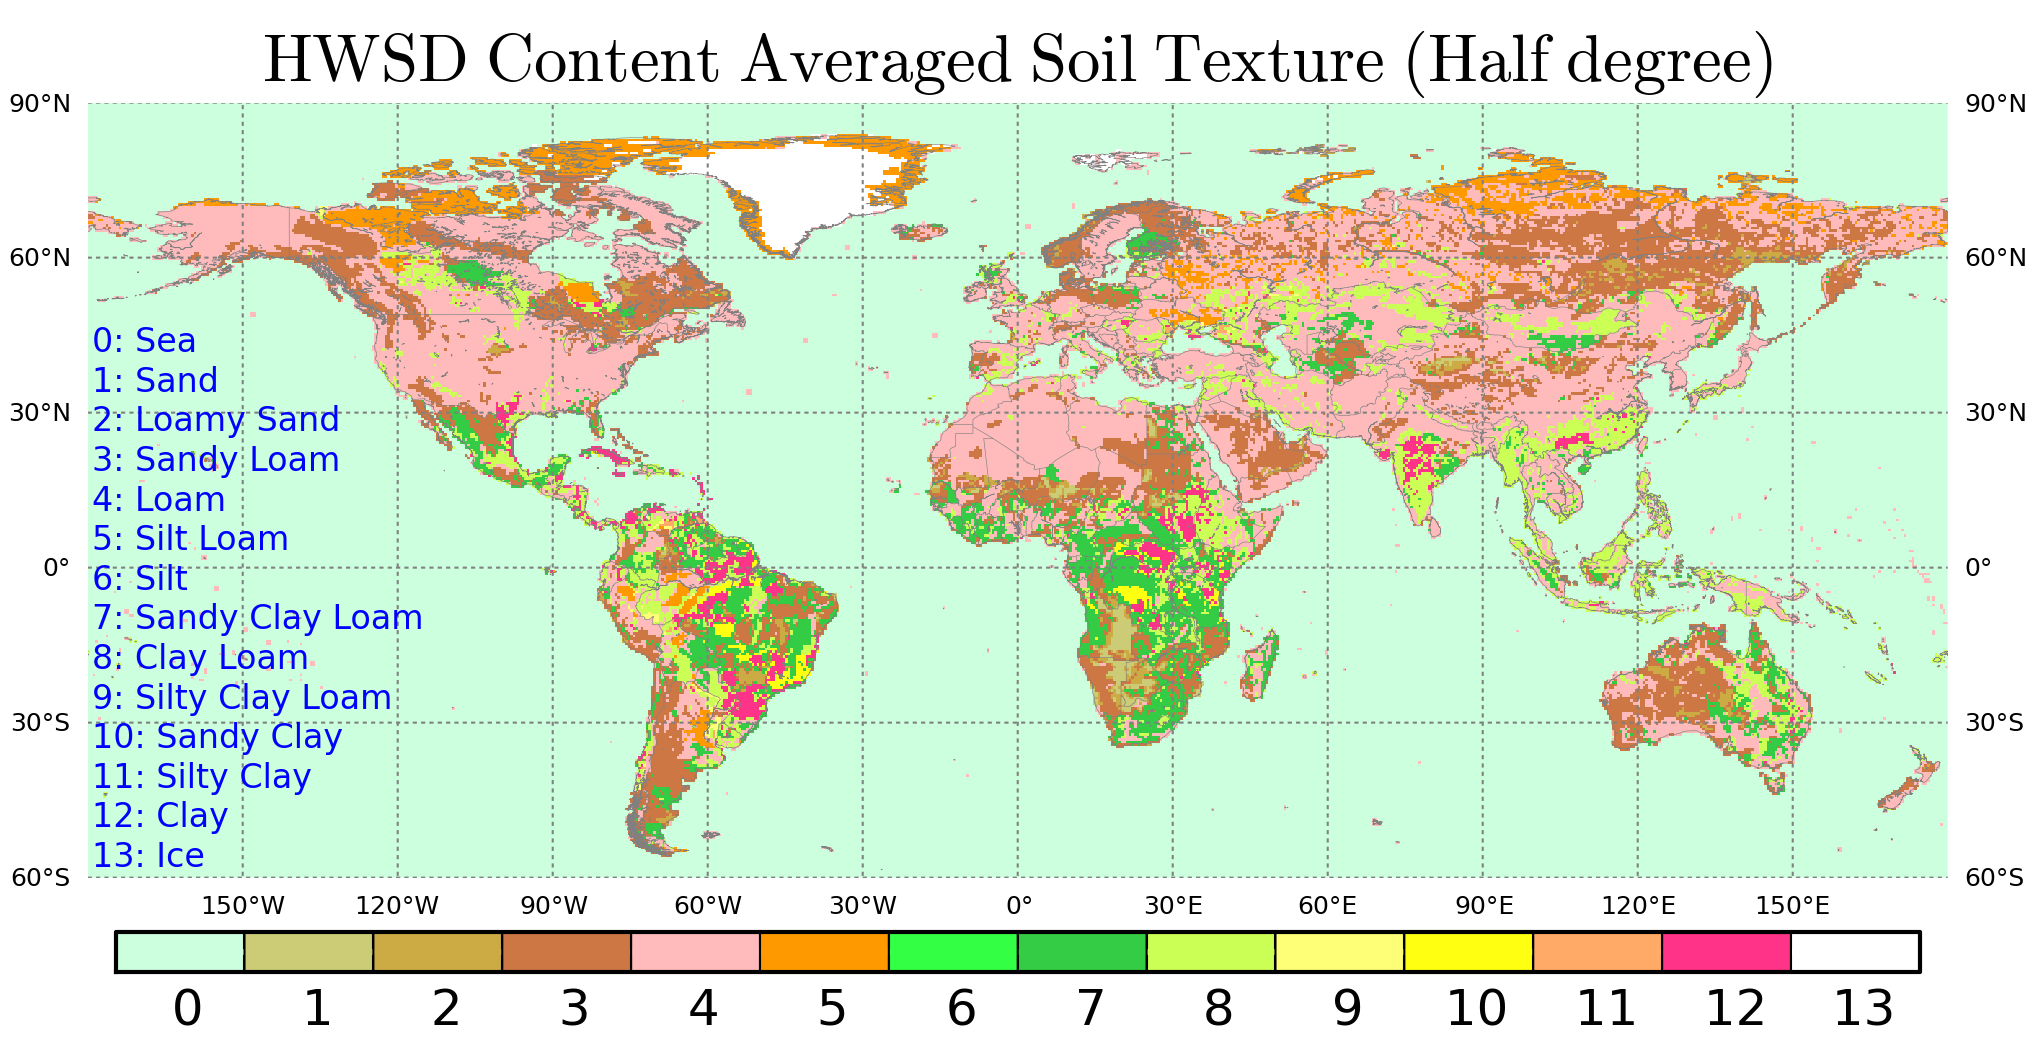 Fig. 1A: Global distribution of soil based on HWSD estimated by averaging the contents of clay, sand, and silt (Method A: half degree version).
 Fig. 1B: Global distribution of soil based on HWSD estimated by counting the major soil type in 30 sec. grids (Method B: half degree version).
Download Links:
The data in binary format can be downloaded from the following links.
Comparison with GSWP2:
For comparison, a half degree soil map (re-gridded from original one degree version) of GSWP-2 project in presented in Figure 3. Compared to HWSD, GSWP-2 has larger number of grid cells with clay. Also, sandy clay loam (7) and clay loam (8) cells in eastern US (Figure 3) are classified as loam (4) in HWSD (Figure 1A). In Siberia, however, larger number of sandy loam grid cells can be seen in HWSD compared to GSWP-2.
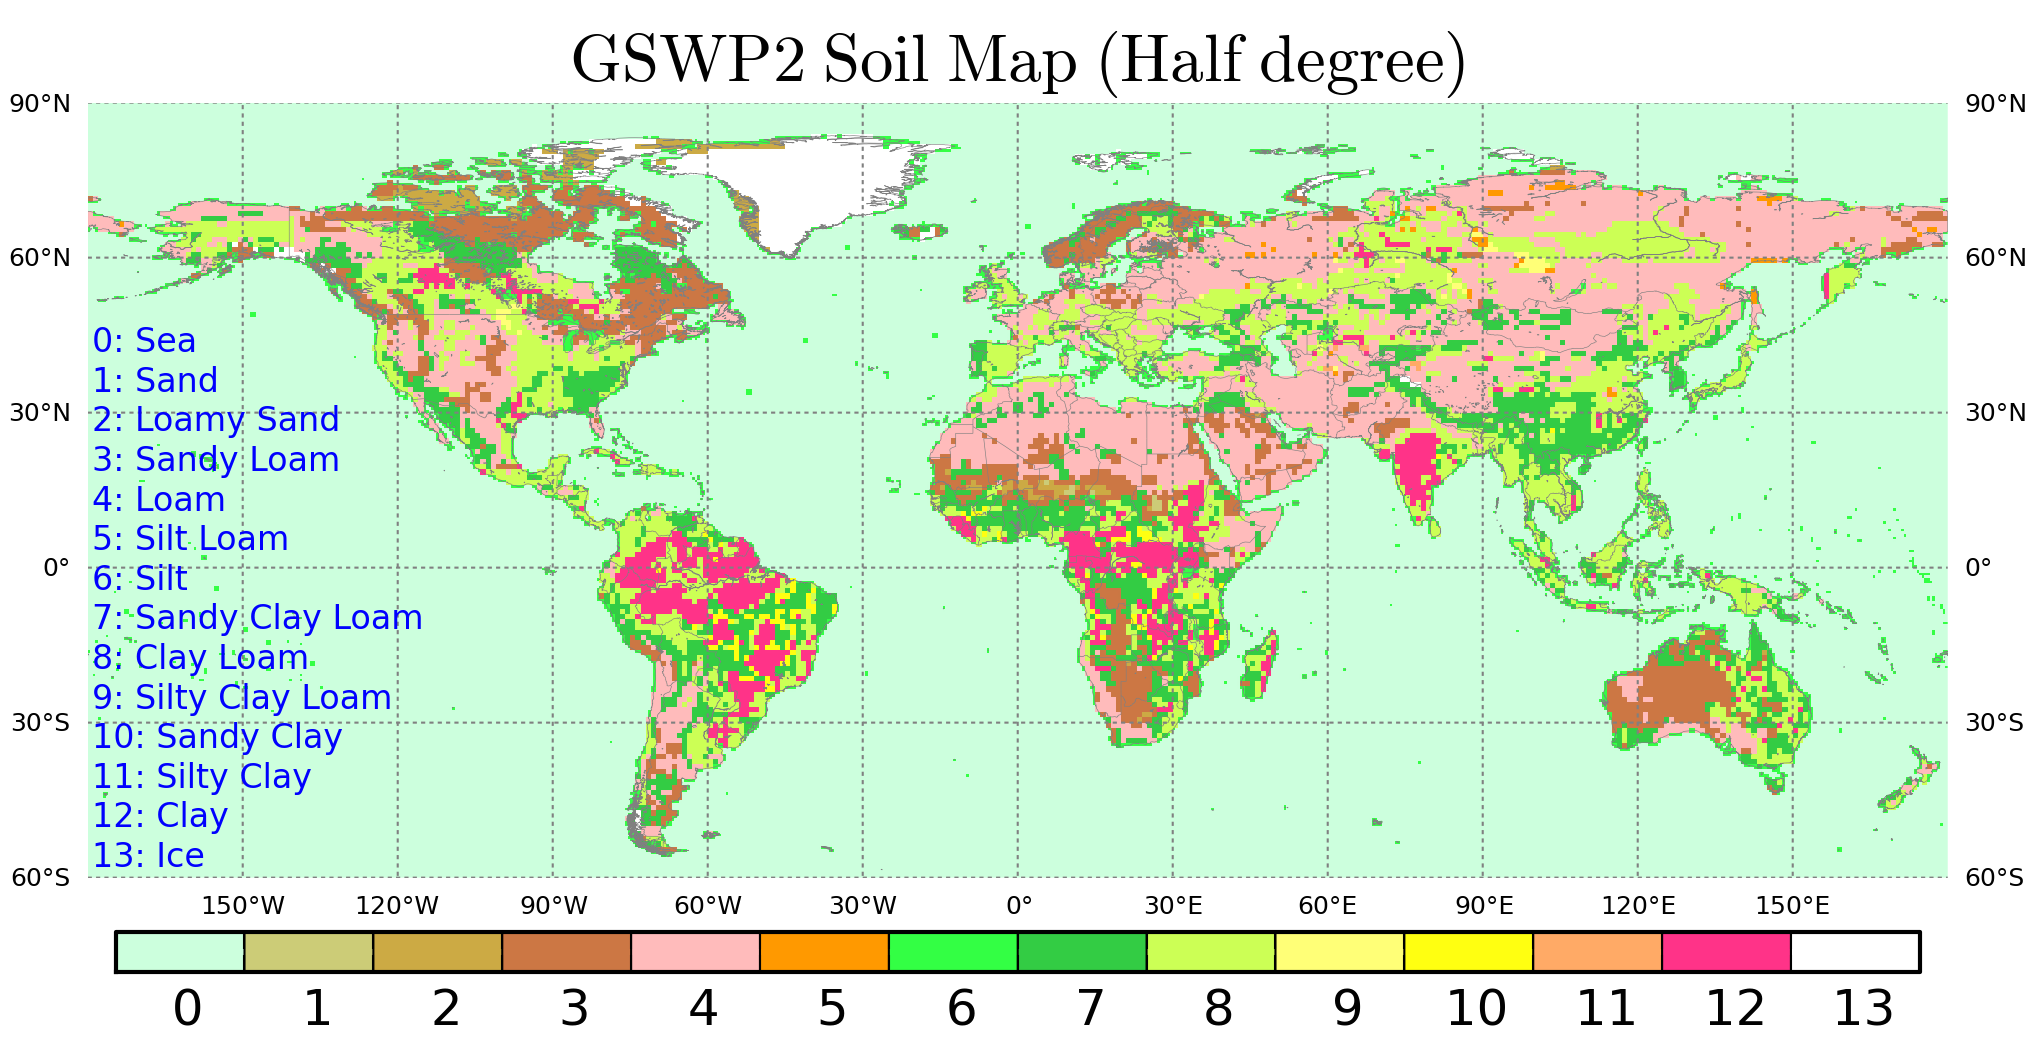 Fig. 3: Global distribution of soil based on GSWP2 (half degree version). |
Properties of Different Soils:
The properties for each type of soil as used in GSWP-2 project (for MATSIRO LSM) is presented in Table 1.
| Table 1: Properties of different type of soils | |||||||
| Soil ID | Soil Type | GRCP | DFG | GWS | DFWS | PSIS | CHB |
| 1 | Sand | 1.30E+06 | 0.3 | 0.37 | 2.45E-05 | -0.05 | 3.3 |
| 2 | Loamy Sand | 1.30E+06 | 0.3 | 0.39 | 1.75E-05 | -0.07 | 3.8 |
| 3 | Sandy Loam | 1.30E+06 | 0.3 | 0.42 | 8.35E-06 | -0.16 | 4.34 |
| 4 | Loam | 1.30E+06 | 0.3 | 0.48 | 2.36E-06 | -0.65 | 5.25 |
| 5 | Silt Loam | 1.30E+06 | 0.3 | 0.47 | 1.10E-06 | -0.84 | 3.63 |
| 6 | Silt | 1.30E+06 | 0.3 | 0.44 | 4.66E-06 | -0.24 | 5.96 |
| 7 | Sandy Clay Loam | 1.30E+06 | 0.3 | 0.41 | 6.31E-06 | -0.12 | 7.32 |
| 8 | Clay Loam | 1.30E+06 | 0.3 | 0.38 | 1.44E-06 | -0.63 | 8.41 |
| 9 | Silty Clay Loam | 1.30E+06 | 0.3 | 0.45 | 2.72E-06 | -0.28 | 8.34 |
| 10 | Sandy Clay | 1.30E+06 | 0.3 | 0.42 | 4.25E-06 | -0.12 | 9.7 |
| 11 | Silty Clay | 1.30E+06 | 0.3 | 0.48 | 1.02E-06 | -0.58 | 10.78 |
| 12 | Clay | 1.30E+06 | 0.3 | 0.45 | 1.33E-06 | -0.27 | 12.93 |
| 13 | Ice | 1.80E+06 | 2.2 | Not available | |||
| GRCP: | Heat Capacity (J/K.m3) | DFWS: | Sat. Hyd. Conductivity (m/s) | ||||
| DFG: | Thermal Conductivity (W/m.K) | PSIS: | Sat. Matric Potential (m) | ||||
| GWS: | Water Capacity/Porosity (-) | CHB: | Clapp-Hornbergers' factor (-) | ||||