ESP Method based on Long-term Rainfall Forecast
Climatic Indices Selection
Random Forests model is exploited to select climatic indices in dry season and wet season. The 74 climatic indices come from China National Climate Center from 1970 to 2000.
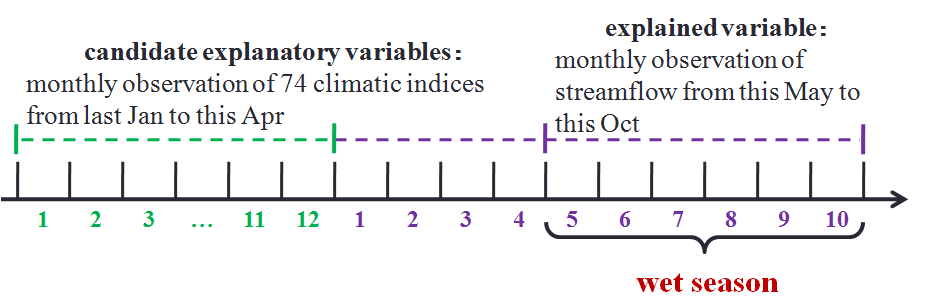
In dry season, the candidate explanatory variables are monthly observation of 74 climatic indices from this Jan to this Oct. The explained variables are monthly observation of streamflow from this Nov to next Apr.
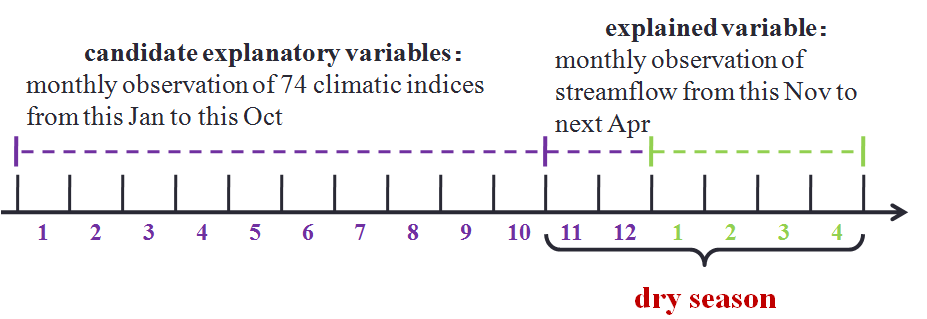
In wet season, the difference is only the start and the end of the month.
Predictors for Baihe monthly streamflow prediction (upper: dry season; lower: wet season)
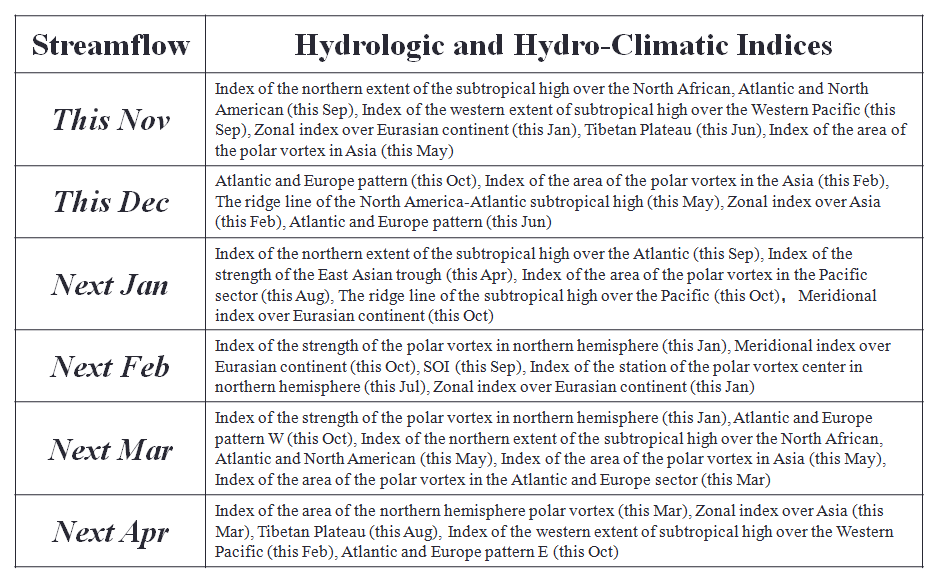
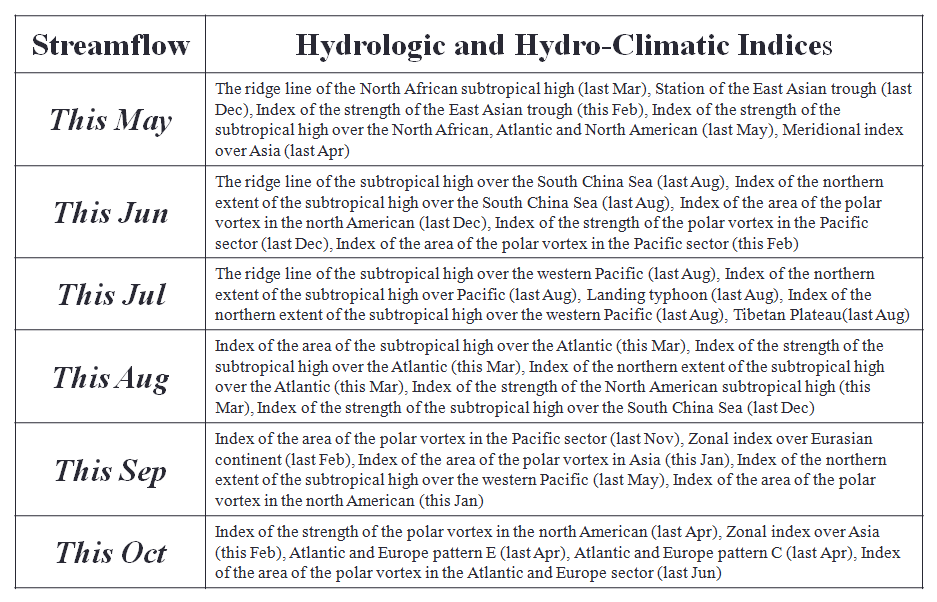
Prediction Schemes
Based on the predictors selected above, this study constructed the single-predictor scheme and multi-predictor scheme. The single-predictor scheme selects the most importanct climatic index and it is regarded as a dominant factor of precipitation in future. While the multi-predictor scheme selects the top 5 most important climatic indices and precipitation of the catchment is considered to be determined by all of these prediction factors. We use the closeness index to select the years which have similar meteorological conditions.
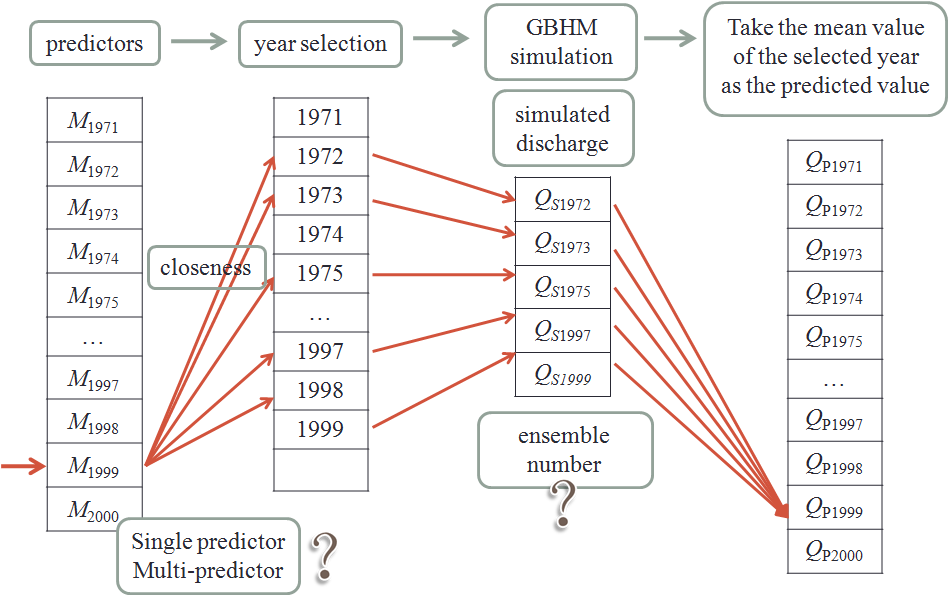
The figure above explains the procedures of establishing predicting schemes. Take the year 1999 as an example. Firstly, using closeness index to select the "close" year which has similar meteorological condtions as 1999 based on the 30 years' predictors. Then using GBHM to get simulated discharge. After this, taking the mean value of the selected year as the predicted value. However, we need to consider two questions, one is shall we take single-predictor scheme or multi-predictor scheme? Another question is how many years we should take for average.
Scheme Selection
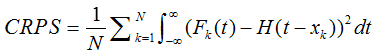
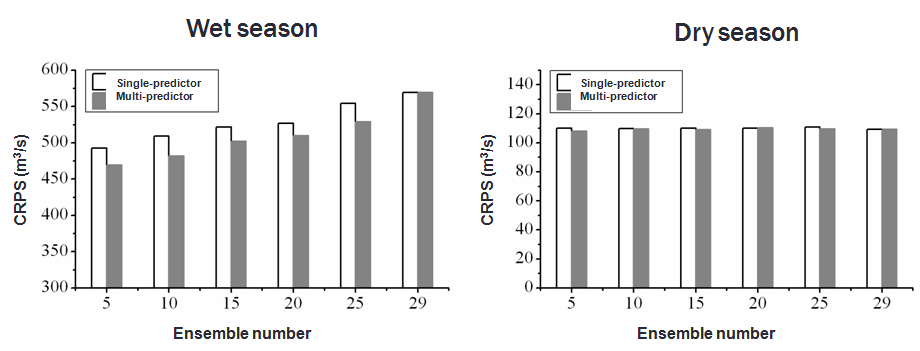
We use CRPS (Continuous Ranked Probability Scores) for the scheme selection. CRPS is an index measuring the forecast error. Therefore, the smaller CRPS is, the better forecast it will be. From the CRPS of dry season and wet season showed in the figures below, we can get the conclusion that multi-predictor scheme is better than single-predictor scheme. However,the ensemble number has different effects on wet season and dry season.
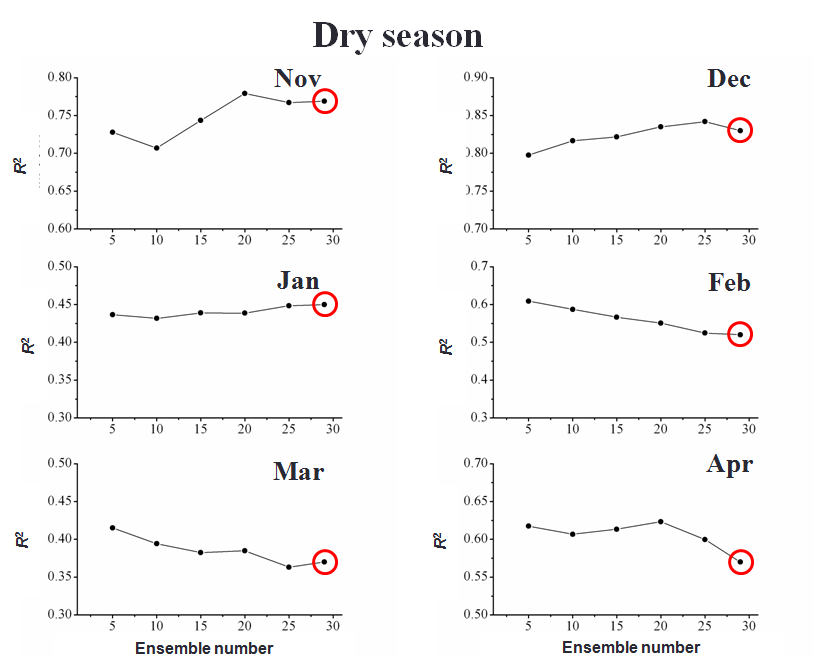
Considering the ensemble number, R2 (correlation coefficient) was applied for evaluation. Red circles in the figures represent conventioanl ESP method (no selection). According to the plots shown from Nov to Apr (dry season), ensemble number has little effect on R2. We can get almost the same accuracy as conventioanl ESP method by using less ensemble number.
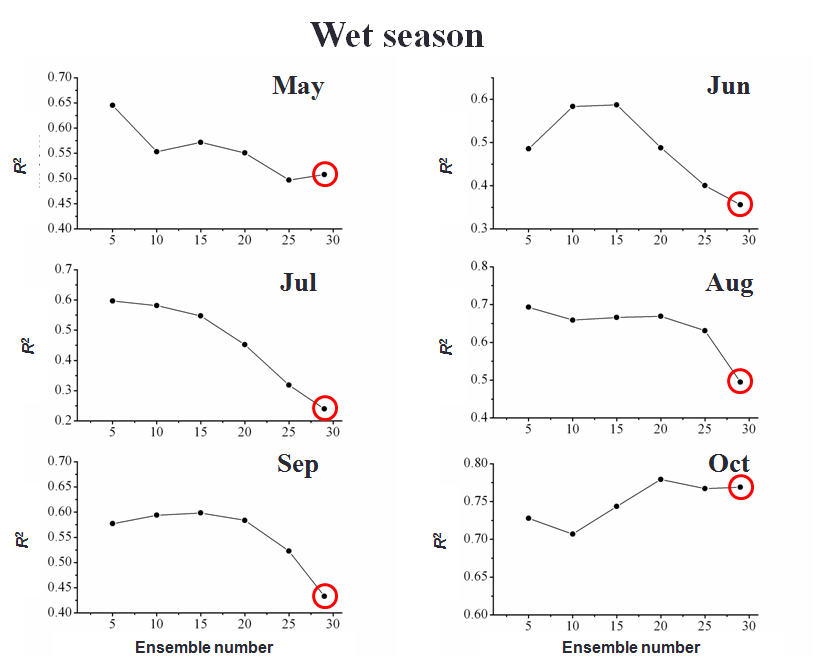
According to the plots from May to Oct (wet season), we can get the information that there is a roughly monotonically decreasing relationship between coefficient and ensemble number. When the ensemble number is 5 or 10, the improving effect is the most salient.
Based on the above analysis, the recommended scheme is multi-predictor scheme of 5 ensembles.
Application of Recommended Schemes
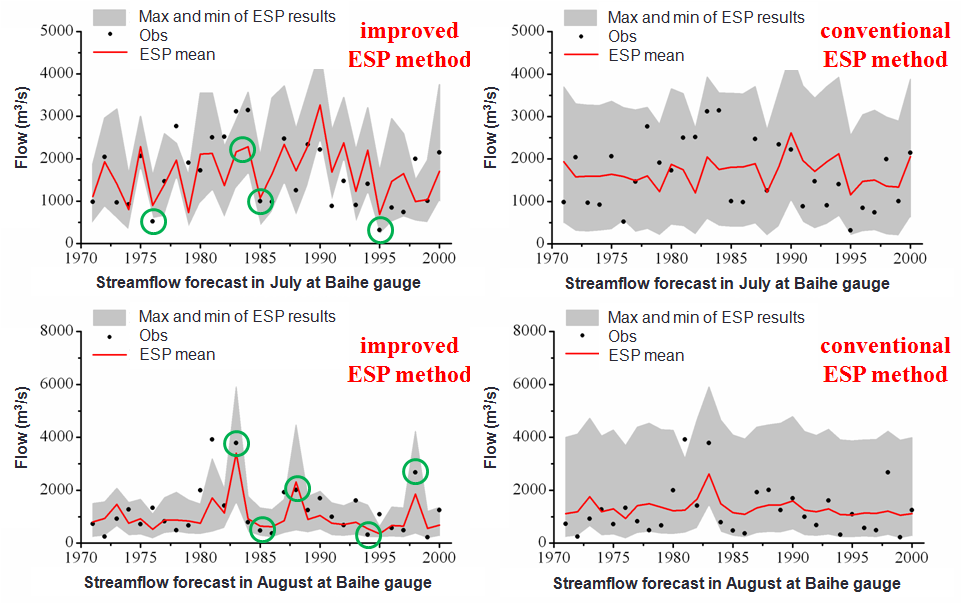
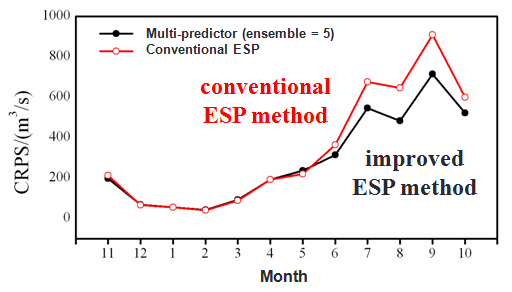
The upper figure shows the difference of CRPS, the index to evaluate the performance of multi-predictor (ensemble=5) scheme and conventional ESP. CRPS indicates that the improved ESP method is better than conventional ESP method and the improvement in wet season is (20% or so) higher than that in dry season (5% or so).
If we compare the improved ESP method and conventional ESP method for the streamflow forecast in July and August at Baihe Gauge, it is obvious that the improved ESP method has close simulation with observation and the uncertainty range can be reduced significantly. What's more, the green circles show that the improved ESP method can have good forecast of the flow trend, drought or flood.