Conventional ESP Method in Hanjiang River
Data preparation
This section will explain data preparation and scenario design. The initial conditons (ICs)include soil moisture, snowpack, and channel flow of every month from 1971 to 2000. We use the meteorological data from 1971 to 2000 too. Rolling forecast is used and the forecast window is one month.

Restrospective ESP Forecast
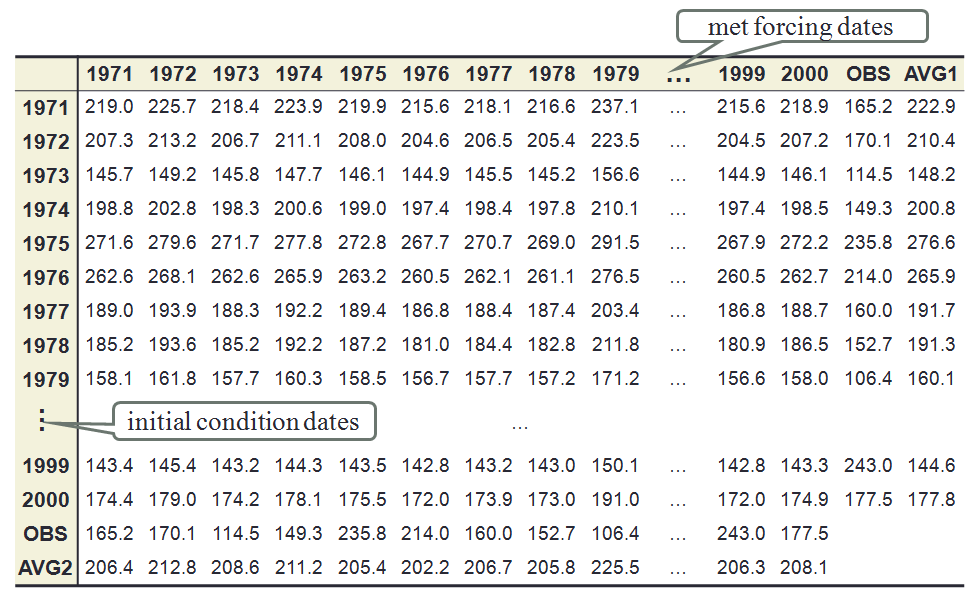
Take January as an example to explain the restrospective ESP forecast. The year associated with the forcing for each member is given as a column label at the top of each column. The initial conditon dates are given as the row labels for each ESP forecast. Statistics of the data are given in the margins of the table. The observed streamflow volume is given for each year as well. The AVG1 acted as the forecast streamflow. For 1971, AVG1 means using the ICs of 1971 and using the meteorological conditions from 1971 to 2000. Based on the table, we can use workspace to test the predictive ability of ESP. Contours of the streamflow volume is shown in the pictures below.
Restrospective ESP Workspace
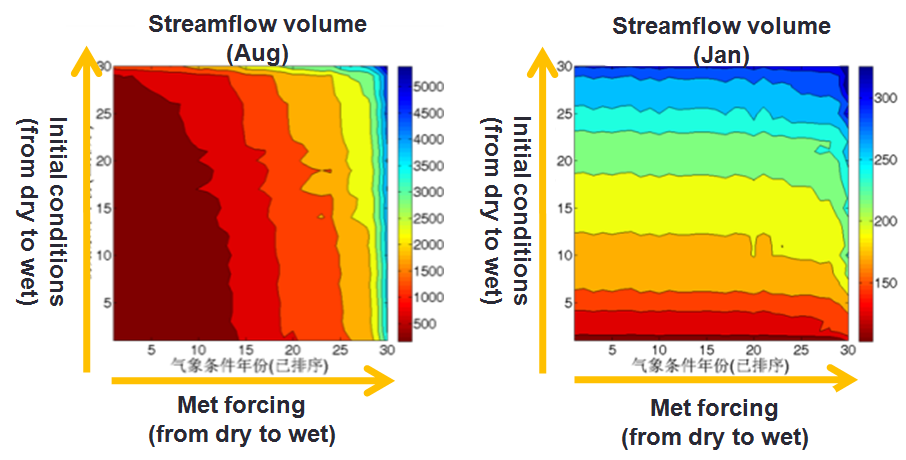
Based on the above table, we can use workspace to test the predictive ability of ESP. Contours of the streamflow volume is shown in the pictures below. The x-axis is the rank of the meteorological forcing from dry to wet and the y-axis is the rank of the initial conditions from dry to wet. From the left figure (typical wet month), we can know that ICs are not sensitive to the streamflow forecast since the gradient of the contour is flat. Conversely, the right figure (typical dry month) shows that ICs are very sensitive to the streamflow forecast.
Evaluation of ESP Forecast
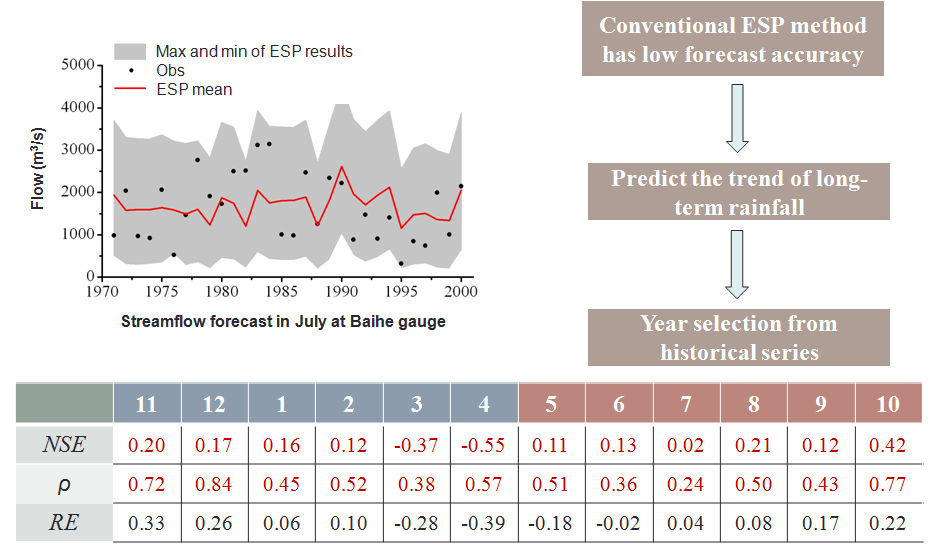
The left figure is the streamflow forecast in July at Baihe Gauge for the wet season, from which we can see that the ESP mean is not a good forecast adn the uncertainty range is quite large. The table below is the evaluation of the forecast using NSE, correlation coefficient and relative error. It is indicatd that conventional ESP method has low forecast accuracy. Therefore, we need to predict the trend of rainfall and select years from historical series.