Front Page
Introduction
General
Flexible Location of Waterways (FLOW) method [Yamazaki et al, 2009] is a sophisticated upscaling algorithm which converts a high-resolution flow direction map into a coarse-resolution river network map, which is used in global-scale river routing models. It also derives sub-grid-scale topographic parameters of the derived river network map, such as channel length, channel altitude, unit-catchment area, and floodplain elevation profile.
FLOW method is specially designed to generate a river network map and its parameters for the global river rouging model, CaMa-Flood [Yamazaki et al., 2010]. The generated maps are designed to be directory applied to CaMa-Flood.
 A river network map and its sub-grid parameters defined in the global river routing model, CaMa-Flood.
The Source code of FLOW method is distributed free of charge, unless it is used for a research purpose. FLOW method is written in Fortran90 and Shell Script. If you have interested in FLOW method, please contact to the developer.
Dai YAMAZAKI:
yamadai [at] rainbow.iis.u-tokyo.ac.jp
Contents
References
Deriving a global river network map and its sub-grid topographic characteristics from a fine-resolution flow direction map
- Yamazaki, D., T. Oki, and S. Kanae
A physically-based description of floodplain inundation dynamics in a global river routing model
- Yamazaki, D., S. Kanae, and T. Oki
Model Framework
0) Input Dataset
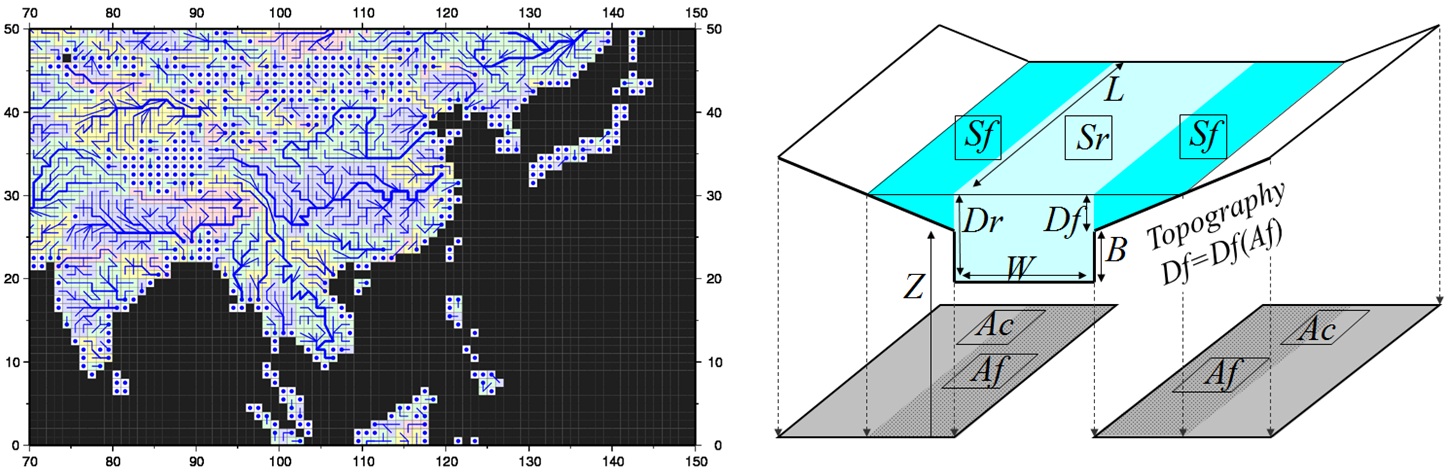
As an input fine-resolution flow direction map, the Global Drainage Basin Database (GDBD) [Masutomi et al., 2009] was used in this study. GDBD describes the downstream direction of each pixel at 1-km resolution in raster format and covers the global range except Greenland and Antarctica. Each GDBD pixel is assumed to have only one downstream direction toward one of the eight neighboring pixels.
The SRTM30 DEM (the 30 arc-second DEM developed in the Shuttle Rader Topography Mission by NASA) was employed as an input DEM for FLOW method. The SRTM30 is one of the most accurate DEMs covering almost the entire globe and has a comparable spatial resolution to GDBD. Due to the difference in geometric projection between GDBD and SRTM30, SRTM30 DEM was spatially interpolated to create a surface elevation map with the same grid coordinate as GDBD. To remove the inland sinks, which interfered with flow going downstream in the surface elevation map, the elevation profile along river channels of GDBD was smoothed by the algorithm explained in [Yamazaki et al., 2010].
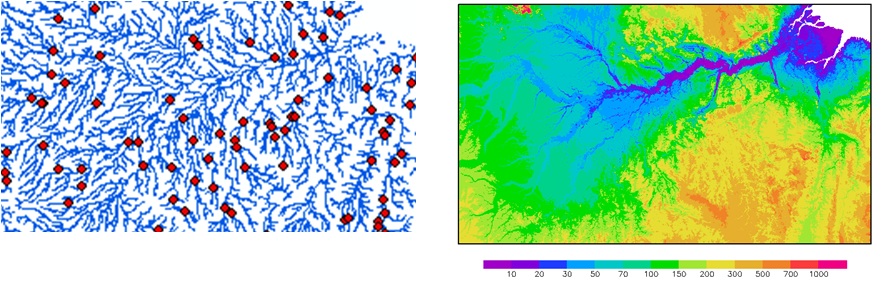
GDBD Flow Direction Map (left) and STRM30 DEM (right)
The procedures for delineating river network parameters for CaMa-Flood by the FLOW method are explained with Figures below. Fine-resolution river paths in Figures were derived from 1-km resolution GDBD.
1) River Network Map
A river network map for CaMa-Flood was created from GDBD. One GDBD pixel within each cell was marked as the outlet pixel of the cell (a pixel marked with a small square in Figure). The fine-resolution river channel of GDBD was traced from the outlet pixel of a target cell until it reached the next outlet pixel downstream. The coarse-resolution cell where the next outlet pixel was located was determined to be the downstream cell of the target cell (the downstream cell of each cell is indicated with a vector in Figure).
2) Channel Altitude
Channel altitude, Z, was defined as the elevation of the outlet pixel for each cell.
3) Channel Length
The channel length, L, of each cell was determined as the length of the fine-resolution river channel between the outlet pixels of the cell and its upstream cell. Where multiple upstream cells exist for one cell, the upstream outlet pixel with largest drainage area was chosen as the representative upstream outlet pixel.
4) Distance to downstream
Similarly, distance to a downstream grid point, X, was decided as the length of the fine-resolution river channel meandering between the outlet pixels of the cell and its downstream cells.
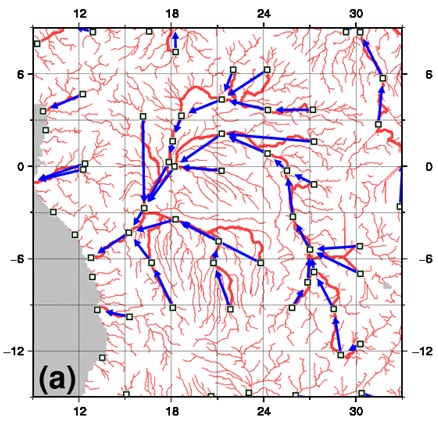
Decision of outlet pixels and river network map.
5) Unit-catchment Area
The group of GDBD pixels that drained into the outlet pixel of each cell was determined as the unit-catchment pixels of the cell (Pixels divided by black boundaries in Figure). The total area of the unit-catchment pixels for each cell was determined as the catchment area, Ac, for the cell. In CaMa-Flood, river flow simulation is done based on this unit-catchment element instead of the traditional rectangular grid-box.
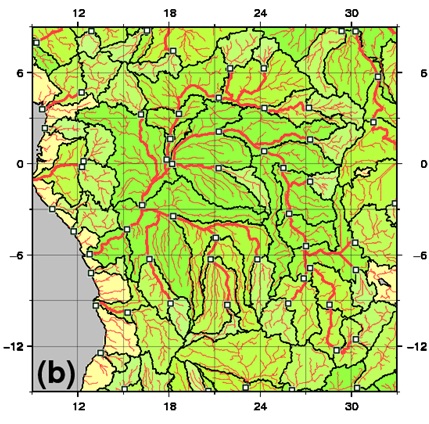
Delineation of unit-catchment for each grid.
6) Floodplain Elevation Profile
The cumulative distribution function (CDF) of the elevation within each unit-catchment was taken to describe the floodplain elevation profile. The horizontal axis of Figure below is the flooded area fraction (i.e., percentage of flooded area, Af, within the unit-catchment, Ac). This CDF describes the relationship between a flooded area, Af, and floodplain water depth, Df. To reduce computational load, every tenth percentile of CDF (dots in Figure) was extracted, and the line connecting these points (sharp line in Figure) was determined as a function to describe the floodplain elevation profile, Df(Af).
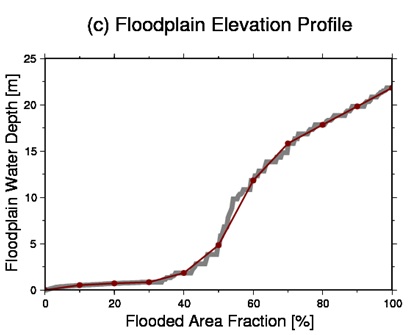
Floodplain Elevation Profile.