matplotlib備忘録
痒い所に手が届く小技を無造作に書き溜めていく.
図の配置の調整
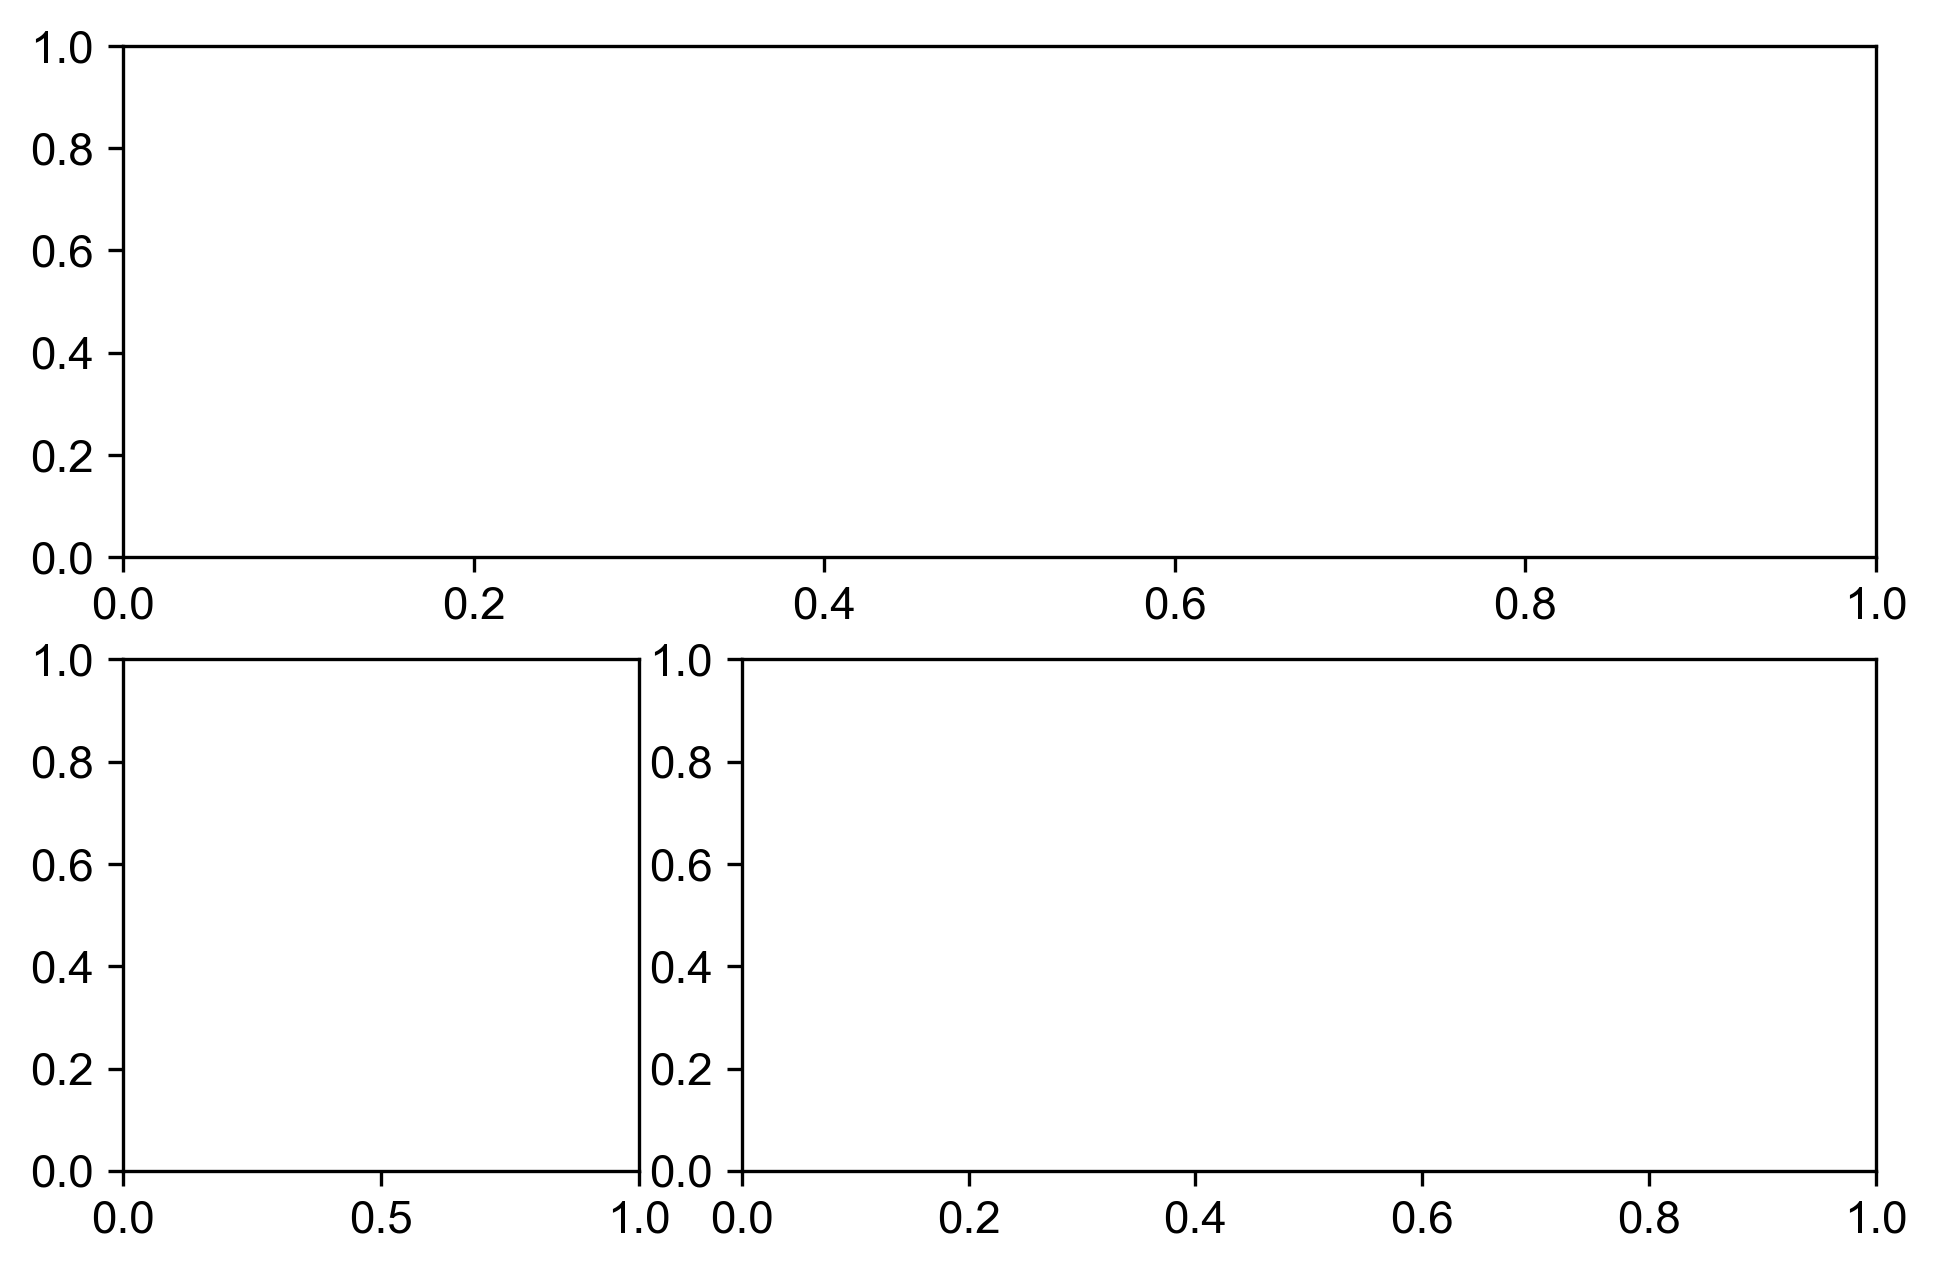
GridSpecを用いた図の配置
縦2行,横3列に図示する場合の例
import matplotlib.pyplot as plt
import matplotlib.gridspec as gridspec
gs = gridspec.GridSpec(2, 3)
plt.subplot(gs[0, :]) # 上の1行目には1枚の横長の図
plt.subplot(gs[1, 0]) # 下の1行目の左下に1枚の図
plt.subplot(gs[1, 1:]) # 下1行目の右2枚分のスペースに1枚の図をそれぞれ配置

図の細かな調整
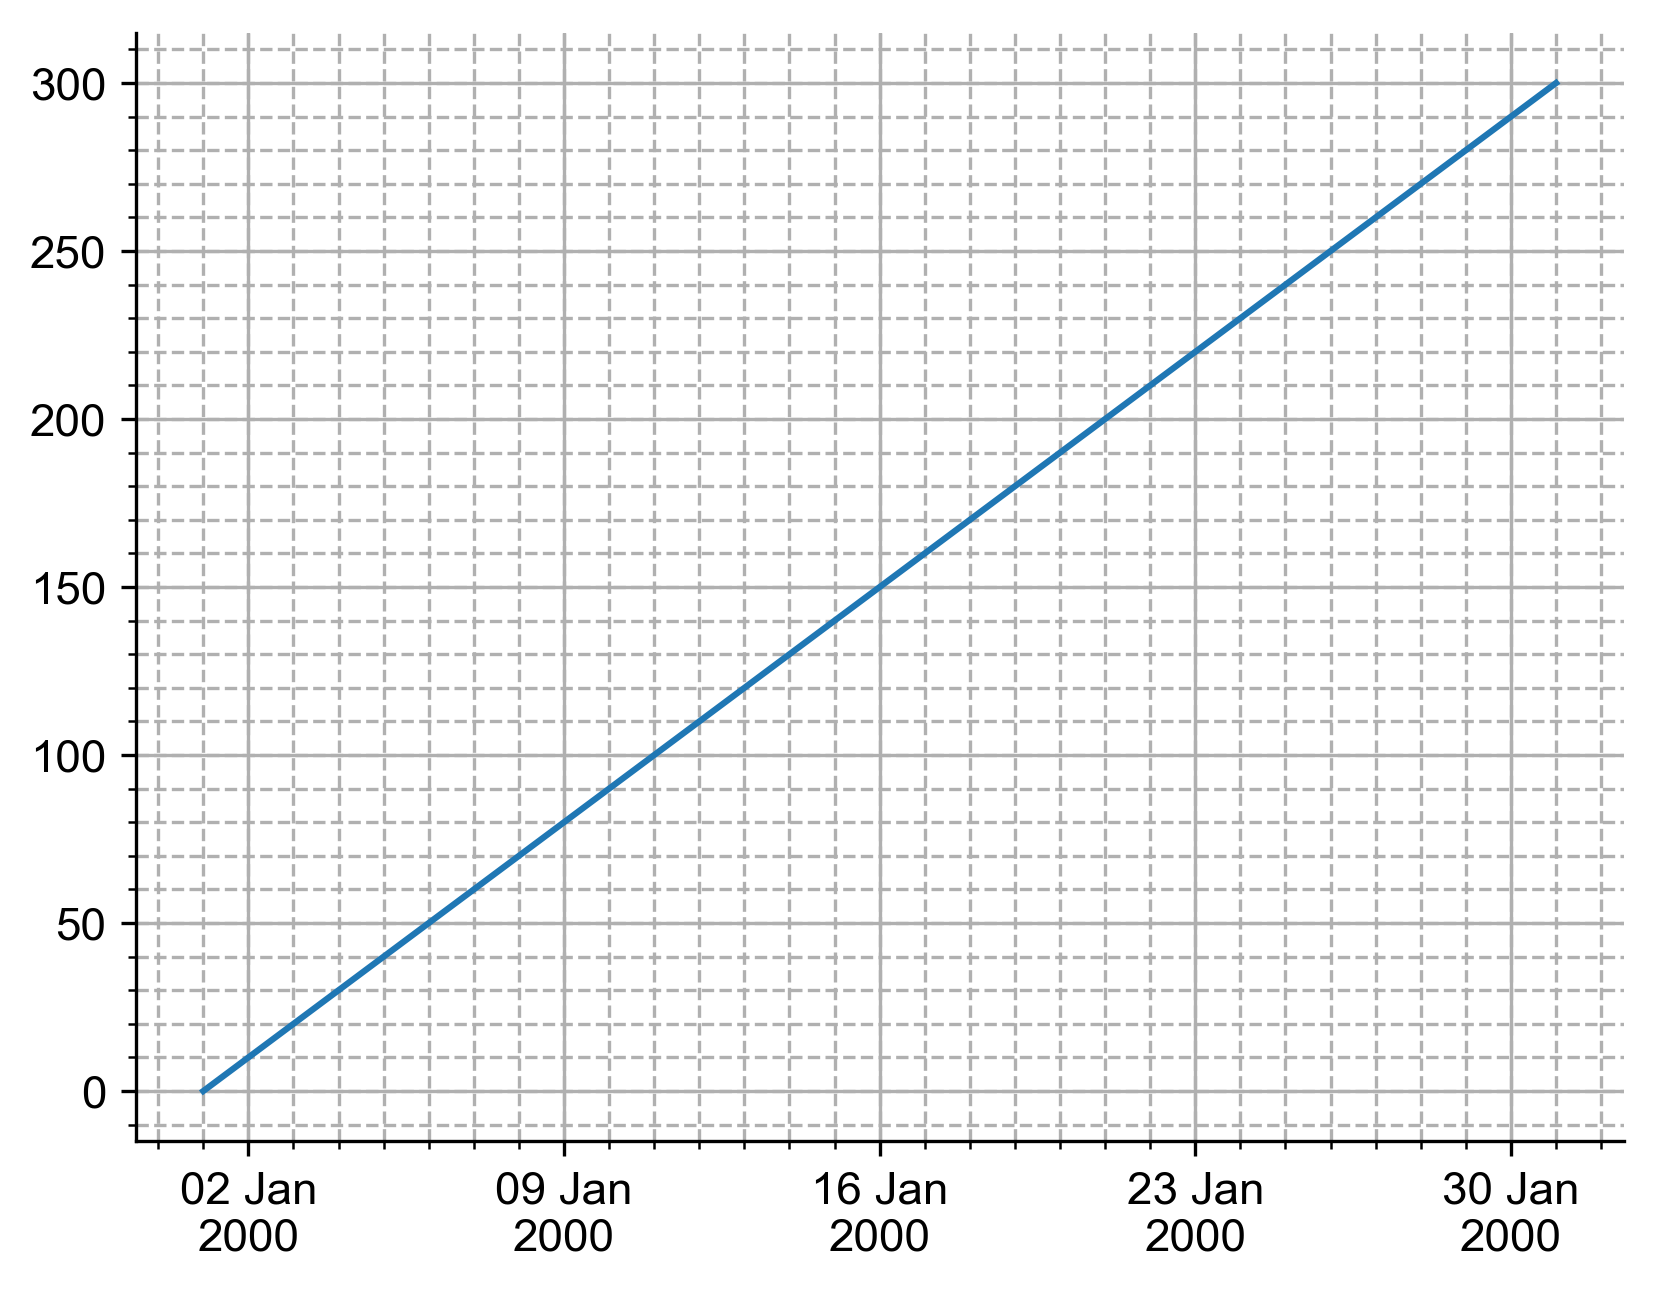
主目盛・補助目盛の調整
import matplotlib.pyplot as plt
import matplotlib.dates as mdates
import matplotlib.ticker as ticker
import datetime
x = [datetime.datetime(2000, 1, 1) + datetime.timedelta(days=i) for i in range(31)]
y = range(0, 310, 10)
plt.figure()
plt.plot(x, y)
# X軸主目盛に年月日を表示
plt.gca().xaxis.set_major_formatter(mdates.DateFormatter("%d %b\n%Y"))
# X軸補助目盛を1日毎に表示
plt.gca().xaxis.set_minor_locator(mdates.DayLocator(interval=1))
# X軸補助目盛を特定の月に表示
plt.gca().xaxis.set_minor_locator(mdates.MonthLocator(bymonth=6))
# X軸補助目盛を特定の日付に表示
plt.gca().xaxis.set_minor_locator(mdates.DayLocator(bymonthday=(10, 20)))
# X軸補助目盛を3時間毎に表示
plt.gca().xaxis.set_minor_locator(mdates.HourLocator(interval=3))
# Y軸補助目盛を10毎に表示
plt.gca().yaxis.set_minor_locator(ticker.MultipleLocator(10))
# 主目盛は実線
plt.grid(True, which="major", linestyle="-")
# 補助目盛は点線
plt.grid(True, which="minor", linestyle="--")
下図はX軸補助目盛を1日毎に表示した例.

グラフの枠線の操作
def set_spines(ax):
    '''
    Setting spines at right and top as none.
    Parameters:
        ax: ax = plt.gca()
    '''
    for loc, spine in ax.spines.iteritems():
        if loc in 'right top'.split():
            spine.set_color('none')
            ax.xaxis.set_ticks_position('bottom')
            ax.yaxis.set_ticks_position('left')
ax = plt.gca() # get current axis
set_spines(ax)

図の中に図形を上書きする
長方形
import matplotlib.pyplot as plt
from matplotlib.patches import Rectangle
plt.figure()
plt.xlim(0, 100)
plt.ylim(0, 100)
ax = plt.gca() # get current axis
x_ll, y_ll = 20, 40 # 長方形の左下の点の座標
dx, dy = 40, 30 # 長方形の幅
r = Rectangle([x_ll, y_ll], dx, dy, edgecolor='r', facecolor='none', linewidth=1)
ax.add_patch(r)
plt.grid(True, alpha=0.7)
グリッド線を引くと図形に上書きされるため、グリッド線の透明度を上げる(alphaを1以下に設定)すると視認性が向上するのがポイント.

図の描画領域の設定
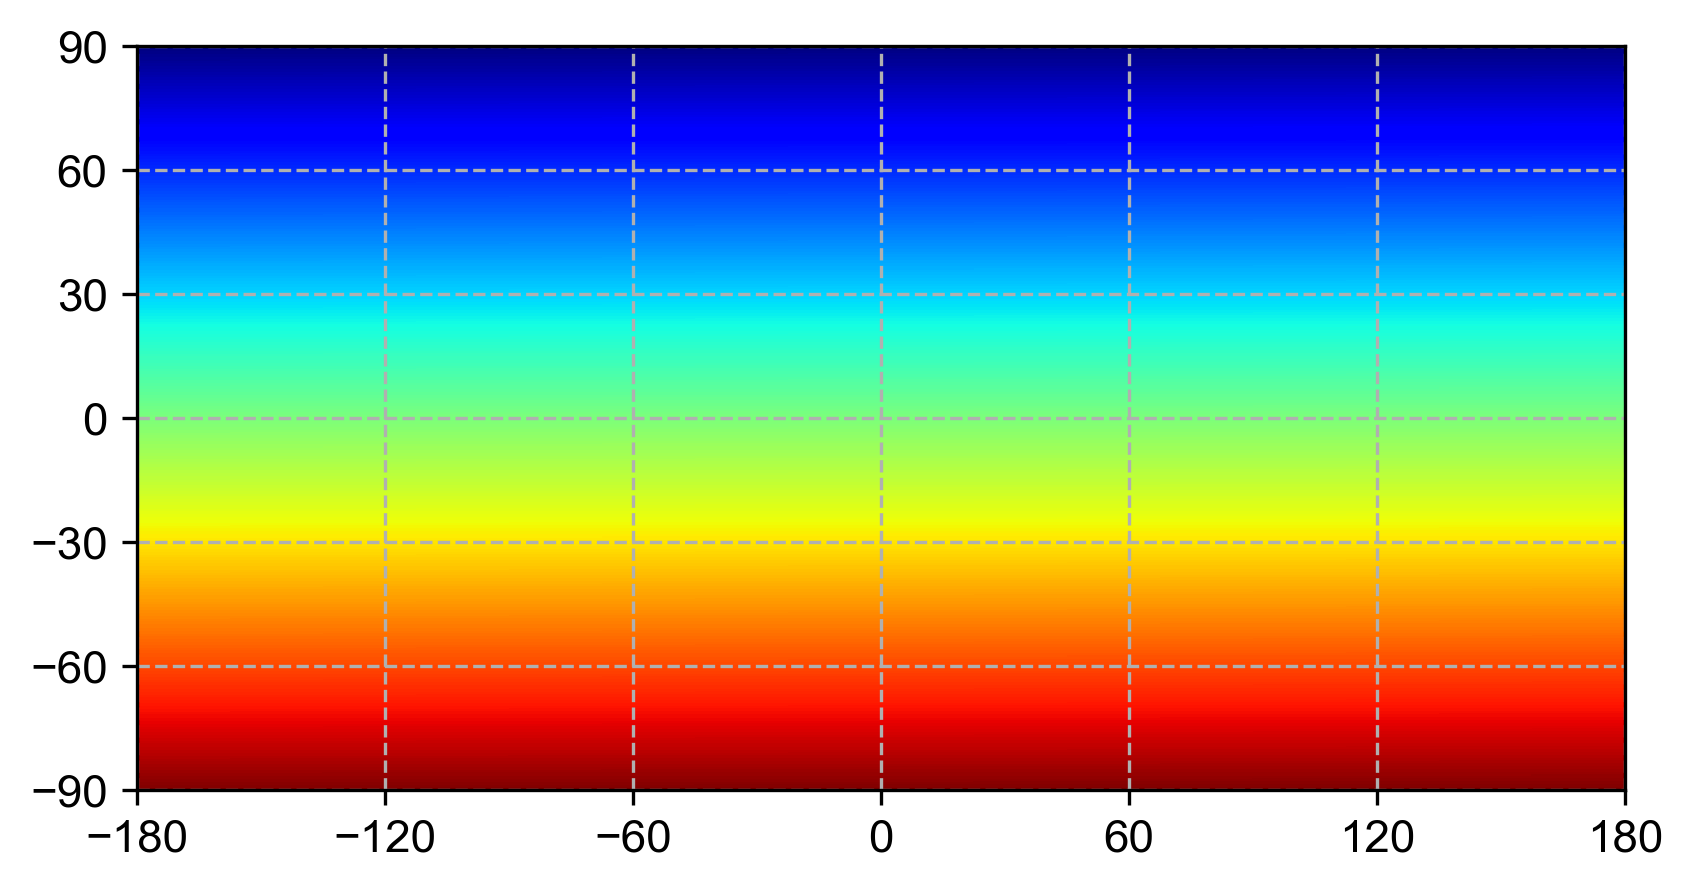
extentオプションの使用
import numpy as np
import matplotlib.pyplot as plt
plt.figure()
data = np.arange(720*1440).reshape(720, 1440)
plt.imshow(data, extent=(-180, 180, -90, 90))
plt.grid(True, alpha=0.6)
plt.xticks(range(-180, 240, 60))
plt.yticks(range(-90, 120, 30))
このように書けば全球地図も容易に描ける.Basemapは極力使いたくないため,このように処理することが多い.

matplotlibのデフォルト値を変更する
pythonをインストールしたディレクトリの中で,lib/site-packages/matplotlib/mpl-data/matplotlibrcを探し,該当行のコメントアウトを外し好みのものに修正(anaconda2の場合はanaconda2-5.1.0/pkgs/matplotlib-2.2.2-py27ha7267d0_0/lib/python2.7/site-packages/matplotlib/matplotlibrc).環境によってデフォルト値が異なることを考慮すると,おそらくmatplotlibrcもdotfilesとしてGitHub管理するのが理想だろう.変更を加えているのは以下の点.
font.family         : Arial
mathtext.default : regular  ## The default font to use for math.
image.cmap   : jet          ## A colormap name, gray etc...
savefig.dpi         : 300   ## figure dots per inch or 'figure'
savefig.bbox        : tight ## 'tight' or 'standard'.
参考リンク


