目次
基本的な使い方
まずは使い方をざっくり説明する.
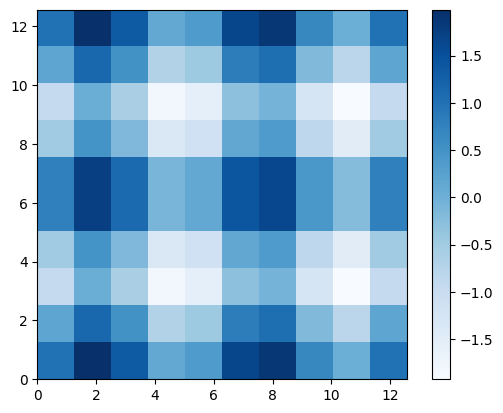 plt.colorbar()は特に指定のない場合,直前に描画したカラーバーを描くことのできるオブジェクト(matplotlib.cm.ScalarMappable)に対してカラーバーを描く.
例えば
plt.colorbar()は特に指定のない場合,直前に描画したカラーバーを描くことのできるオブジェクト(matplotlib.cm.ScalarMappable)に対してカラーバーを描く.
例えば
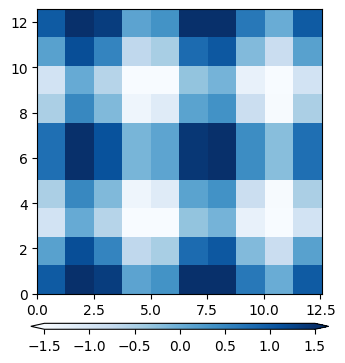
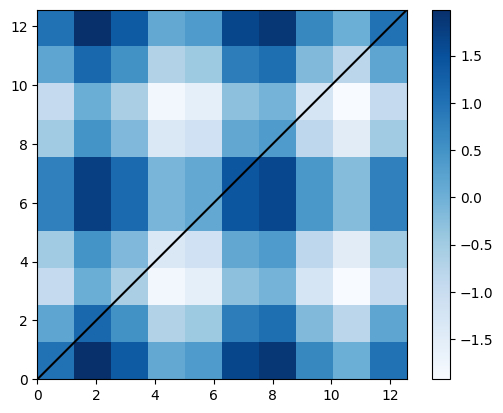 のようにimshowの後にplotでグラフを描画しても,plotで描かれる線グラフはカラーバーの適用対象外なのでimshowで生成された2次元マップに対するカラーバーが描画される.
一方,imshowやscatterで新たに描画を行うとそれに対するカラーバーが描画される.
のようにimshowの後にplotでグラフを描画しても,plotで描かれる線グラフはカラーバーの適用対象外なのでimshowで生成された2次元マップに対するカラーバーが描画される.
一方,imshowやscatterで新たに描画を行うとそれに対するカラーバーが描画される.
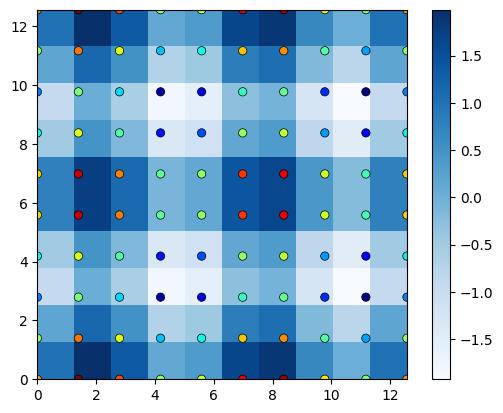
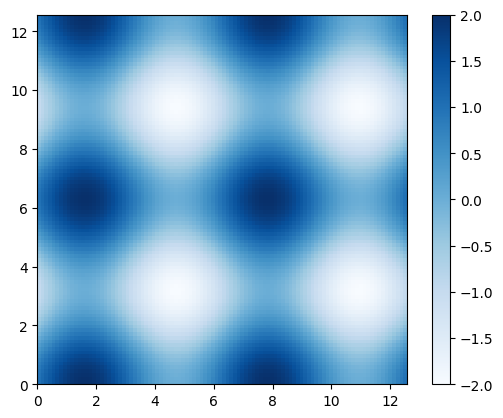
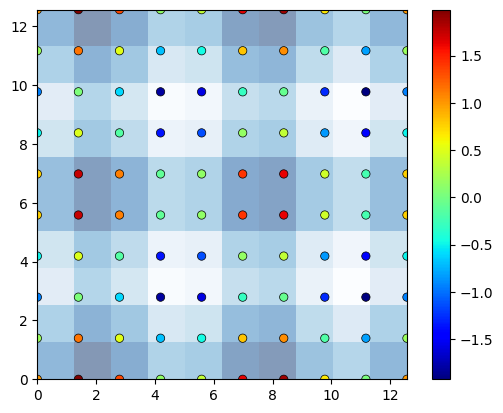 描画したオブジェクトを変数として受け取っておき,それをcolorbar()に与えることでそのオブジェクトに対するカラーバーを描くことができる.
 少し細かい話をすると,api matplotlib.pyplot.colorbar()によってclass matplotlib.colorbar.Colorbarのオブジェクトが生成される.これがカラーバー.
カラーバーの調整は生成する段階で行っても良いし,生成したカラーバーに対して手を加えても良い.
少し細かい話をすると,api matplotlib.pyplot.colorbar()によってclass matplotlib.colorbar.Colorbarのオブジェクトが生成される.これがカラーバー.
カラーバーの調整は生成する段階で行っても良いし,生成したカラーバーに対して手を加えても良い.
plt.colorbar()は特に指定のない場合,直前に描画したカラーバーを描くことのできるオブジェクト(matplotlib.cm.ScalarMappable)に対してカラーバーを描く.
例えば
のようにimshowの後にplotでグラフを描画しても,plotで描かれる線グラフはカラーバーの適用対象外なのでimshowで生成された2次元マップに対するカラーバーが描画される.
一方,imshowやscatterで新たに描画を行うとそれに対するカラーバーが描画される.
描画したオブジェクトを変数として受け取っておき,それをcolorbar()に与えることでそのオブジェクトに対するカラーバーを描くことができる.
少し細かい話をすると,api matplotlib.pyplot.colorbar()によってclass matplotlib.colorbar.Colorbarのオブジェクトが生成される.これがカラーバー.
カラーバーの調整は生成する段階で行っても良いし,生成したカラーバーに対して手を加えても良い.
向きやアスペクト比等を制御する
比較的よく使うキーワード
aspect : 縦横比
pad : 図との間隔
shrink : 図の隣接する軸との長さの比
orientation: 鉛直 ('vertical') か水平 ('horizontal')か
extend : 範囲外の値を表示するか ('neither', 'both', 'min', 'max')
extendfrac : 範囲外部分の長さ
extendrect : 範囲外部分を四角形にする (True, False)
 細かい仕様については公式ドキュメントを参照.
+ matplotlib.pyplot.colorbar — Matplotlib 3.1.1 documentation
細かい仕様については公式ドキュメントを参照.
+ matplotlib.pyplot.colorbar — Matplotlib 3.1.1 documentation
細かい仕様については公式ドキュメントを参照.
+ matplotlib.pyplot.colorbar — Matplotlib 3.1.1 documentation
目盛を制御する
目盛の位置に関しては,
カラーバーを生成する段階でticksを与える
plt.colorbar(ticks=ticks)
もしくはカラーバーを生成してからticksを与える
colorbar.set_ticks(ticks)
どちらでも良い.
ただしplt.colorbar()では目盛のラベルを細かく指定することはできないようなので,そういう場合はカラーバーオブジェクトに対してcbar.set_ticks()を使うと良い.
 値をランクに分けて描画する
不連続なカラーマップを用いて区分ごとに色分けする場合,各区分の中央に区分の名称を書きたい.
(例えば気候区分や植生分布で色分けする場合など)
8つの区分を定義し,これに応じた色分けをしてみる.
区分1が-2~-1, 区分2が-1~-0.5, といった具合.
カラーマップはmatplotlib.colors.ListedColormap()で生成する.引数には色のリストを与える.
ここではカラーマップ"Blues"から色を取り出しているが,名前で指定しても良い.
ticksは各区分の中央の値を取れば良い.
まずset_ticksでticksとlabelsを与えてみる.
値をランクに分けて描画する
不連続なカラーマップを用いて区分ごとに色分けする場合,各区分の中央に区分の名称を書きたい.
(例えば気候区分や植生分布で色分けする場合など)
8つの区分を定義し,これに応じた色分けをしてみる.
区分1が-2~-1, 区分2が-1~-0.5, といった具合.
カラーマップはmatplotlib.colors.ListedColormap()で生成する.引数には色のリストを与える.
ここではカラーマップ"Blues"から色を取り出しているが,名前で指定しても良い.
ticksは各区分の中央の値を取れば良い.
まずset_ticksでticksとlabelsを与えてみる.
 目盛が汚いので消したい.
ラベルに対応する目盛は主目盛,区分の境界にある目盛は副目盛となっているのでそれぞれ調整する.
cbar.ax.tick_params(right=False)
主目盛を表示しないようにする
cbar.set_ticks(ticks, labels=labels)
主目盛の位置とラベルを指定する.ここでは区分の中央に名称を置くことになる.
set_ticks([], minor=True)
副目盛を消す
目盛が汚いので消したい.
ラベルに対応する目盛は主目盛,区分の境界にある目盛は副目盛となっているのでそれぞれ調整する.
cbar.ax.tick_params(right=False)
主目盛を表示しないようにする
cbar.set_ticks(ticks, labels=labels)
主目盛の位置とラベルを指定する.ここでは区分の中央に名称を置くことになる.
set_ticks([], minor=True)
副目盛を消す

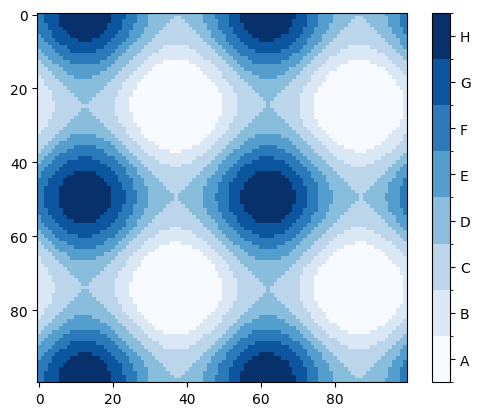
値をランクに分けて描画する
不連続なカラーマップを用いて区分ごとに色分けする場合,各区分の中央に区分の名称を書きたい.
(例えば気候区分や植生分布で色分けする場合など)
8つの区分を定義し,これに応じた色分けをしてみる.
区分1が-2~-1, 区分2が-1~-0.5, といった具合.
カラーマップはmatplotlib.colors.ListedColormap()で生成する.引数には色のリストを与える.
ここではカラーマップ"Blues"から色を取り出しているが,名前で指定しても良い.
ticksは各区分の中央の値を取れば良い.
まずset_ticksでticksとlabelsを与えてみる.
目盛が汚いので消したい.
ラベルに対応する目盛は主目盛,区分の境界にある目盛は副目盛となっているのでそれぞれ調整する.
cbar.ax.tick_params(right=False)
主目盛を表示しないようにする
cbar.set_ticks(ticks, labels=labels)
主目盛の位置とラベルを指定する.ここでは区分の中央に名称を置くことになる.
set_ticks([], minor=True)
副目盛を消す
カラーバーのみを描く
