目次
+ 経緯線を描く
+ 例:ミラー図法
+ 例:ランベルト正角円錐図法
+ 経緯度のラベルを調整する
+ 書式(LongitudeFormatter/LatitudeFormatter)
+ LongitudeFormatter
+ 例:ミラー図法
+ 端のラベルを表示する(PlateCarree, Millerなど)
+ 緯度のラベルを左側だけ表示する&高緯度のラベルを表示する(Robinson, Mollweideなど)
+ 任意の位置に任意のラベルを置く
経緯線を描く
gridlines(crs=None, draw_labels=False, xlocs=None, ylocs=None,
dms=False, x_inline=None, y_inline=None, auto_inline=True,
xformatter=None, yformatter=None, xlim=None, ylim=None,
rotate_labels=None, xlabel_style=None, ylabel_style=None,
labels_bbox_style=None, xpadding=5, ypadding=5,
offset_angle=25, auto_update=False, formatter_kwargs=None,
**kwargs)
cartopy.mpl.geoaxes.GeoAxes.gridlines 公式ドキュメント:
cartopy.mpl.geoaxes.GeoAxes — cartopy 0.22.0 documentation
例:ミラー図法
ラベルが密すぎて重なるようなときは自動的に間引かれる模様.
全部きちんと書きたい場合はxlabel_styleでsizeやrotationを指定して調整すると良い.
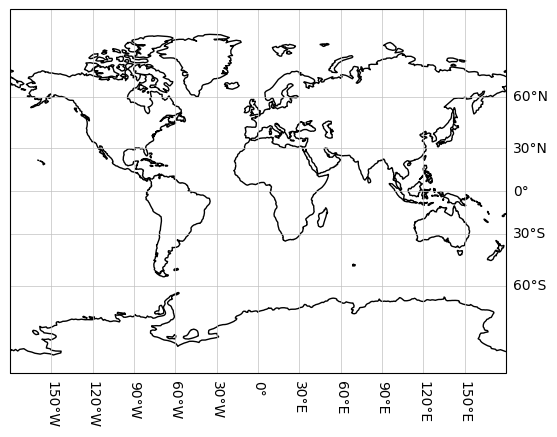 なぜか90°Nと90°S,及び経度180°が表示されない.
この問題については後述.
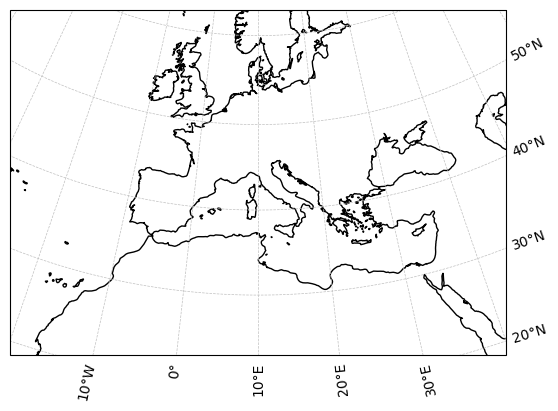
例:ランベルト正角円錐図法
地図の上にラベルが書かれてしまわないよう,x_inline=False, y_inline=Falseを指定する.
なぜか90°Nと90°S,及び経度180°が表示されない.
この問題については後述.
例:ランベルト正角円錐図法
地図の上にラベルが書かれてしまわないよう,x_inline=False, y_inline=Falseを指定する.
なぜか90°Nと90°S,及び経度180°が表示されない.
この問題については後述.
例:ランベルト正角円錐図法
地図の上にラベルが書かれてしまわないよう,x_inline=False, y_inline=Falseを指定する.
経緯度のラベルを調整する
書式(LongitudeFormatter/LatitudeFormatter)
cartopy.mpl.ticker.LongitudeFormatter及びLatitudeFormatterという,経緯度のラベルの書式を調整するためのclassがある.
catropy.mpl.ticker.LongitudeFormatter 公式ドキュメント:
cartopy.mpl.ticker.LongitudeFormatter — cartopy 0.23.0 documentation
cartopy.mpl.ticker.LatitudeFormatter 公式ドキュメント:
cartopy.mpl.ticker.LatitudeFormatter — cartopy 0.23.0 documentation
サンプルコード:
Tick Labels — cartopy 0.23.0 documentation
LongitudeFormatter
class cartopy.mpl.ticker.LongitudeFormatter(direction_label=True, zero_direction_label=False, dateline_direction_label=False, degree_symbol='°', number_format='g', transform_precision=1e-08, dms=False, minute_symbol='′', second_symbol='″', seconds_number_format='g', auto_hide=True, decimal_point=None, cardinal_labels=None)
比較的よく使いそうな引数を簡単に説明する.
direction_label: bool. デフォルト値: True
Trueのとき,経度のラベルに方位を示すE, Wを付ける.
zero_direction_label: bool. デフォルト値: False
Trueのとき,経度0のラベルにEまたはWを付ける.
EとWのどちらが付くかは状況によって自動的に決まり制御できない模様(少なくとも方法は不明).
dateline_direction_label: bool. デフォルト値: False
Trueのとき,経度180のラベルにEまたはWを付ける.
同じくEとWのどちらが付くかは自動で決まる.
degree_symbol: str. デフォルト値: '°'
度を示す記号.空文字列を与えることで消せる.
number_format: str. デフォルト値: 'g'
経度の値の書式を指定する.'.1f'なら'180.0', '0.0'といった具合.dmsがFalseのときのみ有効.
dms: bool. デフォルト値: False
経度を度・分・秒で表示する.
その他,分や秒の記号,方位を示す文字などを制御する引数有り.詳細は公式ドキュメントを参照.
例:ミラー図法
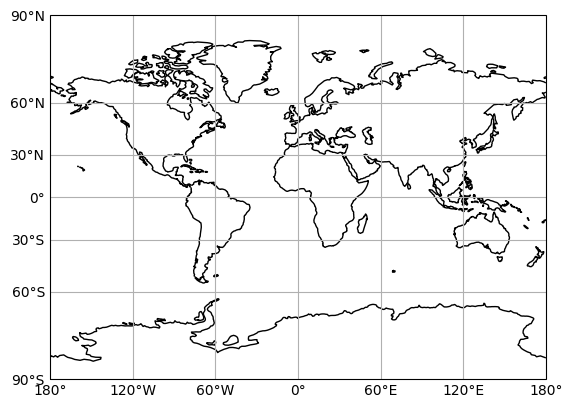 端のラベルを表示する(PlateCarree, Millerなど)
gridlinesでは端のラベルが表示されない問題がある.
・90°N, 90°Sのラベルが表示されない(Fig.1, 2)
ylocsで明示的に指定しても変わらず
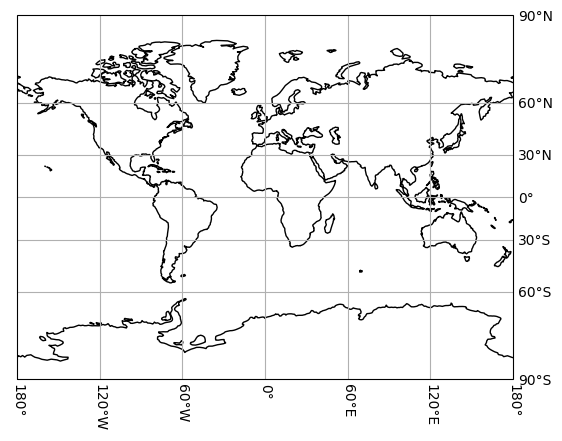
・中心経度180°で描くと右端の経度のラベルが表示されない
上の例でも既にやっているが,結論としてはset_xticksでラベルの位置を制御するのが良さそう.
tick_paramsで目盛を消す(length=0).ラベルを回転させたり右側に移したりもできる.
端のラベルを表示する(PlateCarree, Millerなど)
gridlinesでは端のラベルが表示されない問題がある.
・90°N, 90°Sのラベルが表示されない(Fig.1, 2)
ylocsで明示的に指定しても変わらず
・中心経度180°で描くと右端の経度のラベルが表示されない
上の例でも既にやっているが,結論としてはset_xticksでラベルの位置を制御するのが良さそう.
tick_paramsで目盛を消す(length=0).ラベルを回転させたり右側に移したりもできる.
 tick_paramsの詳細は公式ドキュメントを参照:
matplotlib.axes.Axes.tick_params — Matplotlib 3.8.4 documentation
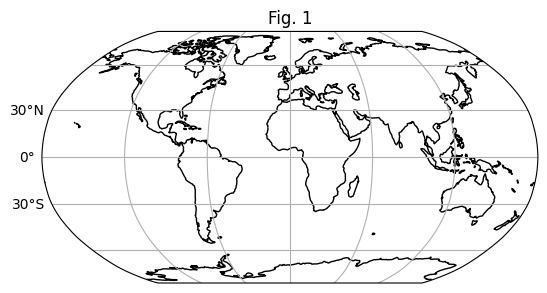
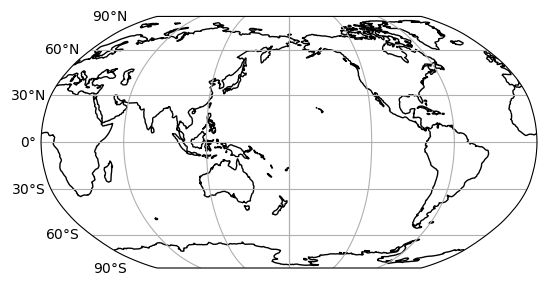
緯度のラベルを左側だけ表示する&高緯度のラベルを表示する(Robinson, Mollweideなど)
これらの投影図法で緯度のラベルを左側だけ表示するのが案外難しい.
問題:
(1) gridlinesでdraw_labels=['left']とすると30°より高緯度のラベルが消える(Fig. 1)
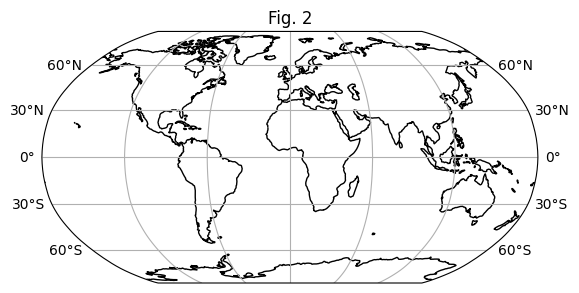
(2) 中心経度0°のとき,draw_labels='y'とすると右側にもラベルが表示されてしまう(Fig. 2)
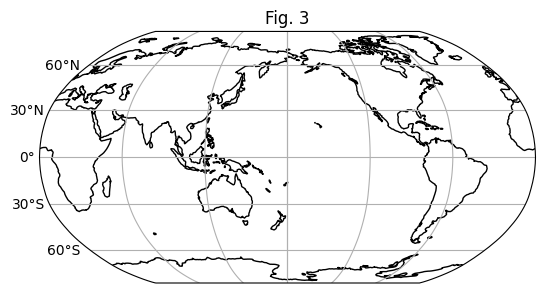
(3) 逆に0°以外だと右側にラベルが表示されない(Fig. 3)
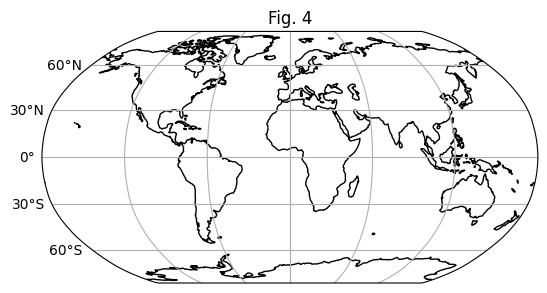
(4) 90°S, 90°Nのラベルが表示されない(Fig. 1~4)
対処法:
(1), (2): xlimを指定する
(3), (4): ax.textを使う(次項)
xlimは横軸方向の描画範囲を指定する.draw_labels='y'としてもxlimで右側の描画範囲を制限すれば右側のラベルは描かれない.残りの経緯線はもう一度gridlinesを使って描く.
tick_paramsの詳細は公式ドキュメントを参照:
matplotlib.axes.Axes.tick_params — Matplotlib 3.8.4 documentation
緯度のラベルを左側だけ表示する&高緯度のラベルを表示する(Robinson, Mollweideなど)
これらの投影図法で緯度のラベルを左側だけ表示するのが案外難しい.
問題:
(1) gridlinesでdraw_labels=['left']とすると30°より高緯度のラベルが消える(Fig. 1)
(2) 中心経度0°のとき,draw_labels='y'とすると右側にもラベルが表示されてしまう(Fig. 2)
(3) 逆に0°以外だと右側にラベルが表示されない(Fig. 3)
(4) 90°S, 90°Nのラベルが表示されない(Fig. 1~4)
対処法:
(1), (2): xlimを指定する
(3), (4): ax.textを使う(次項)
xlimは横軸方向の描画範囲を指定する.draw_labels='y'としてもxlimで右側の描画範囲を制限すれば右側のラベルは描かれない.残りの経緯線はもう一度gridlinesを使って描く.
 任意の位置に任意のラベルを置く
通常の手続きで解決しない場合の最終手段として,ax.textで文字列を配置してしまうという手がある.
面倒なので余程のこだわりが無ければここまでしなくて良いだろう.
pyprojモジュールで座標変換の関数transformerを作り,ラベルを置く座標を緯度経度から計算する.
ax.textではha (horizontalalignment), va (verticalalignment)を適切に設定すると位置の調整がしやすくなる.
ax.text(ha='right')だけだとラベルが地図に近すぎるので,この例では関数adjust_xでラベルの位置を少し左にずらすよう調整している.
任意の位置に任意のラベルを置く
通常の手続きで解決しない場合の最終手段として,ax.textで文字列を配置してしまうという手がある.
面倒なので余程のこだわりが無ければここまでしなくて良いだろう.
pyprojモジュールで座標変換の関数transformerを作り,ラベルを置く座標を緯度経度から計算する.
ax.textではha (horizontalalignment), va (verticalalignment)を適切に設定すると位置の調整がしやすくなる.
ax.text(ha='right')だけだとラベルが地図に近すぎるので,この例では関数adjust_xでラベルの位置を少し左にずらすよう調整している.
端のラベルを表示する(PlateCarree, Millerなど)
gridlinesでは端のラベルが表示されない問題がある.
・90°N, 90°Sのラベルが表示されない(Fig.1, 2)
ylocsで明示的に指定しても変わらず
・中心経度180°で描くと右端の経度のラベルが表示されない
上の例でも既にやっているが,結論としてはset_xticksでラベルの位置を制御するのが良さそう.
tick_paramsで目盛を消す(length=0).ラベルを回転させたり右側に移したりもできる.
tick_paramsの詳細は公式ドキュメントを参照:
matplotlib.axes.Axes.tick_params — Matplotlib 3.8.4 documentation
緯度のラベルを左側だけ表示する&高緯度のラベルを表示する(Robinson, Mollweideなど)
これらの投影図法で緯度のラベルを左側だけ表示するのが案外難しい.
問題:
(1) gridlinesでdraw_labels=['left']とすると30°より高緯度のラベルが消える(Fig. 1)
(2) 中心経度0°のとき,draw_labels='y'とすると右側にもラベルが表示されてしまう(Fig. 2)
(3) 逆に0°以外だと右側にラベルが表示されない(Fig. 3)
(4) 90°S, 90°Nのラベルが表示されない(Fig. 1~4)
対処法:
(1), (2): xlimを指定する
(3), (4): ax.textを使う(次項)
xlimは横軸方向の描画範囲を指定する.draw_labels='y'としてもxlimで右側の描画範囲を制限すれば右側のラベルは描かれない.残りの経緯線はもう一度gridlinesを使って描く.
任意の位置に任意のラベルを置く
通常の手続きで解決しない場合の最終手段として,ax.textで文字列を配置してしまうという手がある.
面倒なので余程のこだわりが無ければここまでしなくて良いだろう.
pyprojモジュールで座標変換の関数transformerを作り,ラベルを置く座標を緯度経度から計算する.
ax.textではha (horizontalalignment), va (verticalalignment)を適切に設定すると位置の調整がしやすくなる.
ax.text(ha='right')だけだとラベルが地図に近すぎるので,この例では関数adjust_xでラベルの位置を少し左にずらすよう調整している.